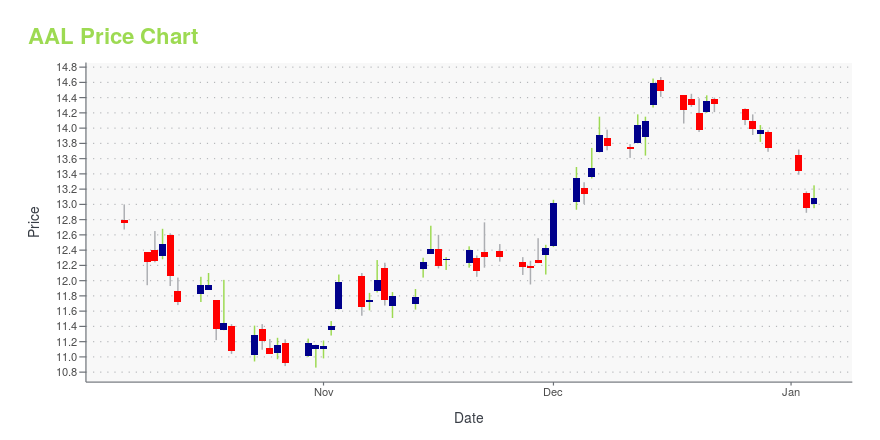
American Airlines Group, Inc. (AAL): Price and Financial Metrics
AAL Price/Volume Stats
| Current price | $16.96 | 52-week high | $19.10 |
| Prev. close | $17.03 | 52-week low | $9.07 |
| Day low | $16.55 | Volume | 37,782,400 |
| Day high | $17.34 | Avg. volume | 33,765,434 |
| 50-day MA | $16.41 | Dividend yield | N/A |
| 200-day MA | $13.03 | Market Cap | 11.14B |
AAL Stock Price Chart Interactive Chart >
American Airlines Group, Inc. (AAL) Company Bio
American Airlines Group is the holding company for American Airlines and US Airways. Together with regional partners, operating as American Eagle and US Airways Express, the airlines operate an average of nearly 6,700 flights per day to nearly 350 destinations in more than 50 countries. American Airlines Group Inc. was founded in 1934 and is based in Fort Worth, Texas.
AAL Price Returns
| 1-mo | -2.25% |
| 3-mo | 24.71% |
| 6-mo | 57.62% |
| 1-year | 12.10% |
| 3-year | 7.48% |
| 5-year | -36.72% |
| YTD | -2.70% |
| 2024 | 26.86% |
| 2023 | 8.02% |
| 2022 | -29.18% |
| 2021 | 13.89% |
| 2020 | -44.81% |
Continue Researching AAL
Here are a few links from around the web to help you further your research on American Airlines Group Inc's stock as an investment opportunity:American Airlines Group Inc (AAL) Stock Price | Nasdaq
American Airlines Group Inc (AAL) Stock Quote, History and News - Yahoo Finance
American Airlines Group Inc (AAL) Stock Price and Basic Information | MarketWatch


Loading social stream, please wait...