
Amazon.com, Inc. (AMZN): Price and Financial Metrics
AMZN Price/Volume Stats
| Current price | $182.50 | 52-week high | $201.20 |
| Prev. close | $179.85 | 52-week low | $118.35 |
| Day low | $180.24 | Volume | 29,505,900 |
| Day high | $183.19 | Avg. volume | 42,501,219 |
| 50-day MA | $187.14 | Dividend yield | N/A |
| 200-day MA | $167.30 | Market Cap | 1.90T |
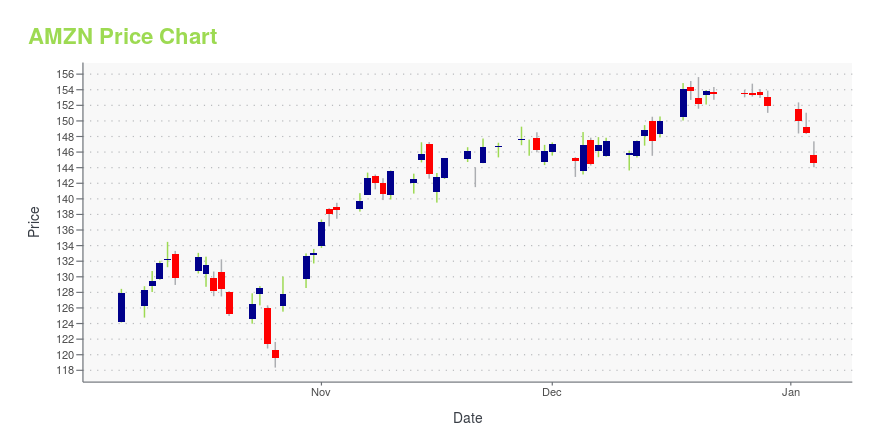
AMZN Stock Price Chart Interactive Chart >
Amazon.com, Inc. (AMZN) Company Bio
Originally called “Cadabra,” Amazon.com, Inc’s website was launched on July 16th, 1995 by CEO and founder Jeff Bezos, selling only books online. Amazon provides a full suite of online retail shopping services. Moreover, the company has expanded beyond retail e-commerce to focus on four discrete customer sets: consumers, sellers, enterprises, and content creators. The company also provides other marketing and promotional services, such as online advertising and co-branded credit card agreements. In addition, Amazon manufactures and sells products such as, Kindle E-reader, Fire tablets, Fire TV, Amazon Echo, and Alexa. The company operates through three segments: North America, International, and Amazon Web Services (AWS). The North America segment consists of retail sales of consumer products and subscriptions through North America-focused websites such as www.amazon.com and www.amazon.ca. The International segment consists of retail sales of consumer products and subscriptions through internationally focused locations. AWS is the largest cloud computing platform, and the primary profit driver for Amazon. In 2020, AWS broke the record of being a $10 billion business. Amazon controls more than a third of the cloud market, almost twice its next closest competitor.
Latest AMZN News From Around the Web
Below are the latest news stories about AMAZON COM INC that investors may wish to consider to help them evaluate AMZN as an investment opportunity.
E-Commerce Evolution: 3 Retail Stocks Transforming Shopping in 2024After making heavy investments in their e-commerce operations, these retail stocks expect increased sales in 2024. |
Trading The Super Seven: RecapIn this article, we will review the performance of each of the Super Seven companies that may help you understand why they are “the talk of the town.” |
2024’s Power Players: 7 Stocks Racing to a Trillion ValuationWhether in 2024, or in the years ahead, each of these seven stocks could become the next trillion dollar companies. |
Legacy Investments: 7 Stocks to Make Your Grandkids MillionairesIf you believe in long-term investing like me, you will look for stocks that have a strong performance history and an ability to thrive in uncertain situations. |
AI and Automation Leaders for 2024: 7 Stocks to Stay Ahead of the Robot UprisingIt’s time for investors to ditch the search for the mythical crystal ball and instead embrace the algorithms when deciphering the best AI stock for your needs. |
AMZN Price Returns
| 1-mo | -5.74% |
| 3-mo | 1.60% |
| 6-mo | 14.69% |
| 1-year | 42.30% |
| 3-year | 0.65% |
| 5-year | 87.85% |
| YTD | 20.11% |
| 2023 | 80.88% |
| 2022 | -49.62% |
| 2021 | 2.38% |
| 2020 | 76.26% |
| 2019 | 23.03% |
Continue Researching AMZN
Want to do more research on Amazon Com Inc's stock and its price? Try the links below:Amazon Com Inc (AMZN) Stock Price | Nasdaq
Amazon Com Inc (AMZN) Stock Quote, History and News - Yahoo Finance
Amazon Com Inc (AMZN) Stock Price and Basic Information | MarketWatch
Loading social stream, please wait...