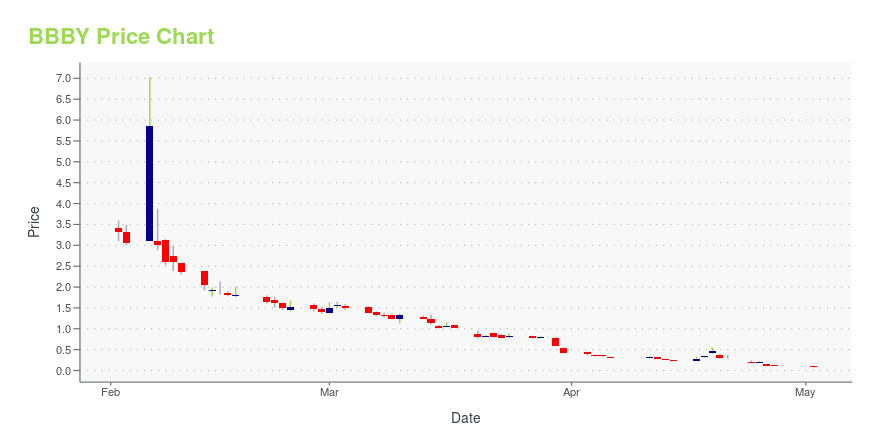
Bed Bath & Beyond Inc. (BBBY): Price and Financial Metrics
BBBY Price/Volume Stats
| Current price | $0.08 | 52-week high | $30.00 |
| Prev. close | $0.10 | 52-week low | $0.07 |
| Day low | $0.07 | Volume | 192,179,900 |
| Day high | $0.10 | Avg. volume | 122,761,367 |
| 50-day MA | $0.77 | Dividend yield | N/A |
| 200-day MA | $4.26 | Market Cap | 32.15M |
BBBY Stock Price Chart Interactive Chart >
Bed Bath & Beyond Inc. (BBBY) Company Bio
Bed Bath & Beyond operates a chain of retail stores, offering a range of domestics merchandise, including bed linens and related items, bath items, kitchen textiles, home furnishings, fine tabletops, basic housewares, general home furnishings, and other merchandise. The company was founded in 1971 and is based in Union, New Jersey.
BBBY Price Returns
| 1-mo | N/A |
| 3-mo | N/A |
| 6-mo | N/A |
| 1-year | N/A |
| 3-year | N/A |
| 5-year | -99.52% |
| YTD | N/A |
| 2023 | 0.00% |
| 2022 | -82.78% |
| 2021 | -17.91% |
| 2020 | 4.99% |
| 2019 | 60.83% |
Continue Researching BBBY
Want to see what other sources are saying about Bed Bath & Beyond Inc's financials and stock price? Try the links below:Bed Bath & Beyond Inc (BBBY) Stock Price | Nasdaq
Bed Bath & Beyond Inc (BBBY) Stock Quote, History and News - Yahoo Finance
Bed Bath & Beyond Inc (BBBY) Stock Price and Basic Information | MarketWatch


Loading social stream, please wait...