Alphabet Inc. (GOOGL): Price and Financial Metrics
GET POWR RATINGS... FREE!
GOOGL POWR Grades
- Quality is the dimension where GOOGL ranks best; there it ranks ahead of 92.13% of US stocks.
- The strongest trend for GOOGL is in Growth, which has been heading down over the past 179 days.
- GOOGL's current lowest rank is in the Momentum metric (where it is better than 8.66% of US stocks).
GOOGL Stock Summary
- GOOGL has a market capitalization of $1,279,286,120,000 -- more than approximately 99.96% of US stocks.
- Equity multiplier, or assets relative to shareholders' equity, comes in at 1.41 for ALPHABET INC; that's greater than it is for only 22.71% of US stocks.
- The volatility of ALPHABET INC's share price is greater than that of 99.45% US stocks with at least 200 days of trading history.
- Stocks with similar financial metrics, market capitalization, and price volatility to ALPHABET INC are AMZN, MSFT, BRK.B, TSLA, and NVDA.
- Visit GOOGL's SEC page to see the company's official filings. To visit the company's web site, go to www.abc.xyz.
GOOGL Valuation Summary
- In comparison to the median Technology stock, GOOGL's price/sales ratio is 70.37% higher, now standing at 4.6.
- GOOGL's price/earnings ratio has moved down 123.6 over the prior 224 months.
Below are key valuation metrics over time for GOOGL.
Stock | Date | P/S | P/B | P/E | EV/EBIT |
---|---|---|---|---|---|
GOOGL | 2023-01-27 | 4.6 | 5.1 | 19.2 | 16.3 |
GOOGL | 2023-01-26 | 4.5 | 5.0 | 18.8 | 16.0 |
GOOGL | 2023-01-25 | 4.4 | 4.9 | 18.4 | 15.7 |
GOOGL | 2023-01-24 | 4.5 | 5.0 | 18.9 | 16.1 |
GOOGL | 2023-01-23 | 4.6 | 5.1 | 19.3 | 16.4 |
GOOGL | 2023-01-20 | 4.5 | 5.0 | 18.9 | 16.1 |
GOOGL Growth Metrics
- The 5 year net income to common stockholders growth rate now stands at 66.8%.
- Its 2 year net cashflow from operations growth rate is now at 80.6%.
- Its 5 year revenue growth rate is now at 75.88%.

The table below shows GOOGL's growth in key financial areas (numbers in millions of US dollars).
Date | Revenue | Operating Cash Flow | Net Income to Common Stock |
---|---|---|---|
2022-09-30 | 282,113 | 92,815 | 66,990 |
2022-06-30 | 278,139 | 95,001 | 72,016 |
2022-03-31 | 270,334 | 97,469 | 74,539 |
2021-12-31 | 257,637 | 91,652 | 76,033 |
2021-09-30 | 239,210 | 89,395 | 70,618 |
2021-06-30 | 220,265 | 80,859 | 62,929 |
GOOGL's Quality Factors
The “Quality” component of the POWR Ratings focuses on 31 different factors of a companies fundamentals and operational strength. Here are some key insights as we drill into the specifics of these quality attributes.- GOOGL has a Quality Grade of B, ranking ahead of 90.92% of graded US stocks.
- GOOGL's asset turnover comes in at 0.72 -- ranking 215th of 561 Business Services stocks.
- SLNM, ID, and MSTR are the stocks whose asset turnover ratios are most correlated with GOOGL.
The table below shows GOOGL's key quality metrics over time.
Period | Asset Turnover | Gross Margin | ROIC |
---|---|---|---|
2021-09-30 | 0.720 | 0.565 | 0.338 |
2021-06-30 | 0.688 | 0.557 | 0.309 |
2021-03-31 | 0.643 | 0.543 | 0.266 |
2020-12-31 | 0.624 | 0.536 | 0.217 |
2020-09-30 | 0.609 | 0.536 | 0.188 |
2020-06-30 | 0.609 | 0.542 | 0.172 |
GOOGL Price Target
For more insight on analysts targets of GOOGL, see our GOOGL price target page. And for a list of of all stocks sorted by upside potential based on analyst target price, see our Top Price Target page.
Average Price Target | $3,135.42 | Average Broker Recommendation | 1.36 (Strong Buy) |
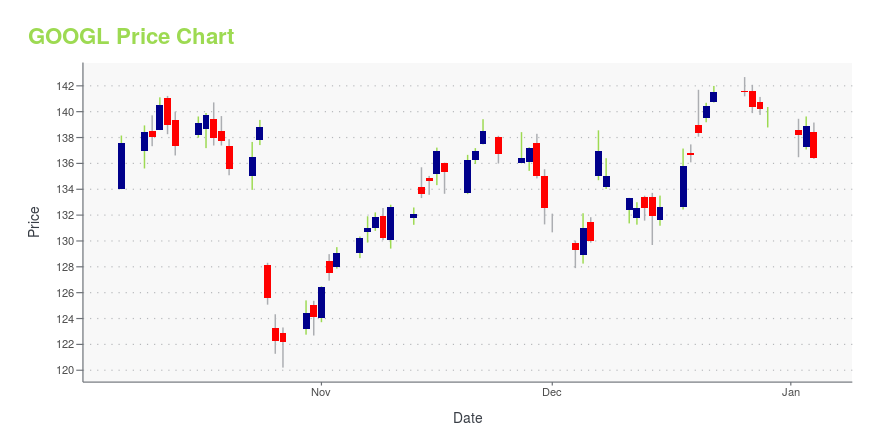
GOOGL Stock Price Chart Interactive Chart >
GOOGL Price/Volume Stats
Current price | $98.84 | 52-week high | $151.55 |
Prev. close | $96.94 | 52-week low | $83.34 |
Day low | $96.82 | Volume | 29,870,600 |
Day high | $98.88 | Avg. volume | 33,643,059 |
50-day MA | $93.52 | Dividend yield | N/A |
200-day MA | $105.14 | Market Cap | 1.28T |
Alphabet Inc. (GOOGL) Company Bio
Google offers a range of products across screens and devices. The Company delivers both performance advertising and brand advertising. The Performance advertising creates and delivers relevant ads, which leads to direct engagement with advertisers. The company was founded in 1998 and is based in Mountain View, California.
Latest GOOGL News From Around the Web
Below are the latest news stories about ALPHABET INC that investors may wish to consider to help them evaluate GOOGL as an investment opportunity.
Big Week Ahead – Strategies For FOMC, Payrolls, Mega-Cap EarningsThere are some weeks when we look ahead and wonder what might drive markets over the coming days. This week is not one of them. |
The 7 Best Growth Stocks for the Next 5 YearsFor optimistic and patient investors alike, the next five years may represent viable opportunities for the best growth stocks to buy. |
Cloud Stocks: Microsoft Challenges Google With OpenAI PartnershipMicrosoft is expected to be adding ChatGPT to its Bing search engine. If Microsoft were to do that, it may finally make Bing a real competitor to Google’s search. |
Most Active Equity Options For Midday - Friday, Jan. 27Here are the most active equity options for midday. |
Most Active Equity Options For Midday - Wed., Jan. 26Here are the most active equity options for midday. |
GOOGL Price Returns
1-mo | N/A |
3-mo | 18.47% |
6-mo | -15.86% |
1-year | -28.19% |
3-year | 37.97% |
5-year | 76.63% |
YTD | 12.03% |
2022 | -39.09% |
2021 | 65.30% |
2020 | 30.85% |
2019 | 28.18% |
2018 | -0.80% |
Continue Researching GOOGL
Here are a few links from around the web to help you further your research on Alphabet Inc's stock as an investment opportunity:Alphabet Inc (GOOGL) Stock Price | Nasdaq
Alphabet Inc (GOOGL) Stock Quote, History and News - Yahoo Finance
Alphabet Inc (GOOGL) Stock Price and Basic Information | MarketWatch
Loading social stream, please wait...