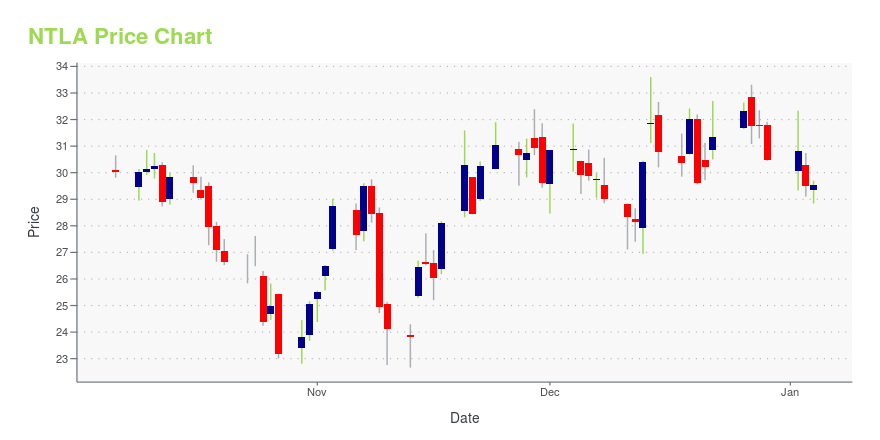
Intellia Therapeutics, Inc. (NTLA): Price and Financial Metrics
NTLA Price/Volume Stats
Current price | $30.41 | 52-week high | $51.94 |
Prev. close | $30.93 | 52-week low | $22.67 |
Day low | $30.07 | Volume | 594,260 |
Day high | $31.86 | Avg. volume | 1,070,121 |
50-day MA | $28.55 | Dividend yield | N/A |
200-day MA | $37.05 | Market Cap | 2.72B |
NTLA Stock Price Chart Interactive Chart >
NTLA POWR Grades
- Sentiment is the dimension where NTLA ranks best; there it ranks ahead of 27.98% of US stocks.
- NTLA's strongest trending metric is Growth; it's been moving down over the last 177 days.
- NTLA ranks lowest in Momentum; there it ranks in the 6th percentile.
NTLA Stock Summary
- The capital turnover (annual revenue relative to shareholder's equity) for NTLA is 0.05 -- better than merely 11.63% of US stocks.
- Of note is the ratio of INTELLIA THERAPEUTICS INC's sales and general administrative expense to its total operating expenses; just 7.77% of US stocks have a lower such ratio.
- NTLA's price/sales ratio is 41.75; that's higher than the P/S ratio of 96.78% of US stocks.
- If you're looking for stocks that are quantitatively similar to INTELLIA THERAPEUTICS INC, a group of peers worth examining would be DNLI, IGMS, MORF, ARWR, and RNA.
- Visit NTLA's SEC page to see the company's official filings. To visit the company's web site, go to www.intelliatx.com.
NTLA Valuation Summary
- NTLA's price/sales ratio is 48; this is 2723.53% higher than that of the median Healthcare stock.
- Over the past 91 months, NTLA's EV/EBIT ratio has gone up 45.3.
Below are key valuation metrics over time for NTLA.
Stock | Date | P/S | P/B | P/E | EV/EBIT |
---|---|---|---|---|---|
NTLA | 2023-11-03 | 48.0 | 2.3 | -5.6 | -5.5 |
NTLA | 2023-11-02 | 44.2 | 2.1 | -5.2 | -5.1 |
NTLA | 2023-11-01 | 42.5 | 2.0 | -5.0 | -4.9 |
NTLA | 2023-10-31 | 41.8 | 2.0 | -4.9 | -4.8 |
NTLA | 2023-10-30 | 39.8 | 1.9 | -4.7 | -4.5 |
NTLA | 2023-10-27 | 38.6 | 1.9 | -4.5 | -4.4 |
NTLA Growth Metrics
- Its 2 year revenue growth rate is now at -16.95%.
- Its 3 year price growth rate is now at 237.58%.
- Its 4 year cash and equivalents growth rate is now at -68.55%.

The table below shows NTLA's growth in key financial areas (numbers in millions of US dollars).
Date | Revenue | Operating Cash Flow | Net Income to Common Stock |
---|---|---|---|
2022-12-31 | 52.121 | -333.287 | -474.186 |
2022-09-30 | 51.402 | -298.069 | -442.016 |
2022-06-30 | 45.34 | -284.565 | -400.431 |
2022-03-31 | 37.86 | -252.455 | -368.559 |
2021-12-31 | 33.053 | -225.03 | -267.892 |
2021-09-30 | 26.794 | -210.605 | -228.847 |
NTLA's Quality Factors
The “Quality” component of the POWR Ratings focuses on 31 different factors of a companies fundamentals and operational strength. Here are some key insights as we drill into the specifics of these quality attributes.- NTLA has a Quality Grade of D, ranking ahead of 18.09% of graded US stocks.
- NTLA's asset turnover comes in at 0.066 -- ranking 302nd of 681 Pharmaceutical Products stocks.
- AGIO, CMRX, and JAZZ are the stocks whose asset turnover ratios are most correlated with NTLA.
The table below shows NTLA's key quality metrics over time.
Period | Asset Turnover | Gross Margin | ROIC |
---|---|---|---|
2021-06-30 | 0.066 | 1 | -0.397 |
2021-03-31 | 0.088 | 1 | -0.420 |
2020-12-31 | 0.120 | 1 | -0.510 |
2020-09-30 | 0.156 | 1 | -0.586 |
2020-06-30 | 0.137 | 1 | -0.536 |
2020-03-31 | 0.135 | 1 | -0.414 |
NTLA Price Target
For more insight on analysts targets of NTLA, see our NTLA price target page. And for a list of of all stocks sorted by upside potential based on analyst target price, see our Top Price Target page.
Average Price Target | $176.19 | Average Broker Recommendation | 1.47 (Moderate Buy) |
Intellia Therapeutics, Inc. (NTLA) Company Bio
Intellia Therapeutics a gene editing company, develops therapeutics utilizing a biological tool known as the CRISPR/Cas9 system. The company develops in vivo programs focused on liver diseases, including transthyretin amyloidosis, alpha-1 antitrypsin deficiency, hepatitis B virus, and inborn errors of metabolism; and ex vivo applications of the technology in chimeric antigen receptor T cell and hematopoietic stem cell product candidates. The company was founded in 2014 and is headquartered in Cambridge, Massachusetts.
Latest NTLA News From Around the Web
Below are the latest news stories about INTELLIA THERAPEUTICS INC that investors may wish to consider to help them evaluate NTLA as an investment opportunity.
Intellia (NTLA) Rises on EC's Orphan Drug Tag for HAE CandidateThe European Commission bestows orphan drug designation to Intellia's (NTLA) in vivo CRISPR-based investigational therapy, NTLA-2002, for treating hereditary angioedema. Stock rises. |
Intellia Therapeutics Receives European Union Orphan Drug Designation for NTLA-2002, an Investigational In Vivo CRISPR Genome Editing Treatment for Hereditary AngioedemaCAMBRIDGE, Mass., Nov. 14, 2023 (GLOBE NEWSWIRE) -- Intellia Therapeutics, Inc. (NASDAQ:NTLA), a leading clinical-stage genome editing company focused on developing potentially curative single-dose therapeutics leveraging CRISPR-based technologies, today announced that the European Commission (EC) has granted orphan drug designation to NTLA-2002 for the treatment of hereditary angioedema (HAE). NTLA-2002 is an in vivo CRISPR-based investigational therapy designed to prevent potentially life-thre |
Need To Know: Analysts Are Much More Bullish On Intellia Therapeutics, Inc. (NASDAQ:NTLA) RevenuesCelebrations may be in order for Intellia Therapeutics, Inc. ( NASDAQ:NTLA ) shareholders, with the analysts delivering... |
Intellia (NTLA) Beats on Q3 Earnings, Provides Pipeline UpdateIntellia (NTLA) reports mixed third-quarter 2023 results. Management provides developmental and regulatory updates on its key pipeline candidates. |
3 Biotech Stocks That Are Betting on the Future of Gene EditingThese three companies have gene editing therapies in late-stage clinical trials, making them promising biotech stocks to buy right now. |
NTLA Price Returns
1-mo | 21.40% |
3-mo | -19.32% |
6-mo | -25.76% |
1-year | -40.91% |
3-year | -22.56% |
5-year | 69.79% |
YTD | -12.84% |
2022 | -70.49% |
2021 | 117.35% |
2020 | 270.82% |
2019 | 7.47% |
2018 | -28.98% |
Continue Researching NTLA
Want to see what other sources are saying about Intellia Therapeutics Inc's financials and stock price? Try the links below:Intellia Therapeutics Inc (NTLA) Stock Price | Nasdaq
Intellia Therapeutics Inc (NTLA) Stock Quote, History and News - Yahoo Finance
Intellia Therapeutics Inc (NTLA) Stock Price and Basic Information | MarketWatch
Loading social stream, please wait...