Public Storage (PSA): Price and Financial Metrics
PSA Price/Volume Stats
Current price | $280.01 | 52-week high | $357.13 |
Prev. close | $283.15 | 52-week low | $270.13 |
Day low | $279.15 | Volume | 909,000 |
Day high | $284.99 | Avg. volume | 1,037,148 |
50-day MA | $292.69 | Dividend yield | 4.23% |
200-day MA | $297.39 | Market Cap | 49.23B |
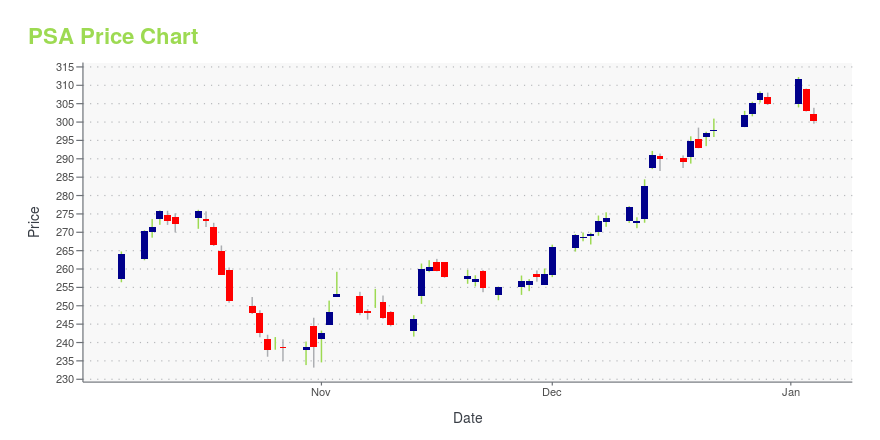
PSA Stock Price Chart Interactive Chart >
PSA POWR Grades
- Quality is the dimension where PSA ranks best; there it ranks ahead of 83.99% of US stocks.
- PSA's strongest trending metric is Momentum; it's been moving down over the last 179 days.
- PSA's current lowest rank is in the Value metric (where it is better than 25.4% of US stocks).
PSA Stock Summary
- With a market capitalization of $49,823,378,833, PUBLIC STORAGE has a greater market value than 95.65% of US stocks.
- Of note is the ratio of PUBLIC STORAGE's sales and general administrative expense to its total operating expenses; just 4.35% of US stocks have a lower such ratio.
- In terms of volatility of its share price, PSA is more volatile than merely 3.42% of stocks we're observing.
- Stocks that are quantitatively similar to PSA, based on their financial statements, market capitalization, and price volatility, are PXD, ET, CNQ, O, and DVN.
- Visit PSA's SEC page to see the company's official filings. To visit the company's web site, go to www.publicstorage.com.
PSA Valuation Summary
- PSA's EV/EBIT ratio is 12.9; this is 48.4% lower than that of the median Real Estate stock.
- Over the past 243 months, PSA's EV/EBIT ratio has gone down 1.1.
Below are key valuation metrics over time for PSA.
Stock | Date | P/S | P/B | P/E | EV/EBIT |
---|---|---|---|---|---|
PSA | 2023-05-11 | 12.1 | 5.2 | 12.5 | 12.9 |
PSA | 2023-05-10 | 12.3 | 5.3 | 12.7 | 13.1 |
PSA | 2023-05-09 | 12.2 | 5.2 | 12.7 | 13.1 |
PSA | 2023-05-08 | 12.1 | 5.2 | 12.6 | 13.0 |
PSA | 2023-05-05 | 12.1 | 5.2 | 12.5 | 13.0 |
PSA | 2023-05-04 | 11.9 | 5.1 | 12.3 | 12.7 |
PSA Growth Metrics
- Its 2 year net income to common stockholders growth rate is now at 41.01%.
- Its 4 year net income to common stockholders growth rate is now at 4.94%.
- The 2 year price growth rate now stands at 92.51%.

The table below shows PSA's growth in key financial areas (numbers in millions of US dollars).
Date | Revenue | Operating Cash Flow | Net Income to Common Stock |
---|---|---|---|
2022-12-31 | 4,182.163 | 3,117.141 | 4,142.288 |
2022-09-30 | 4,017.937 | 3,109.625 | 4,337.724 |
2022-06-30 | 3,824.737 | 2,866.873 | 2,067.89 |
2022-03-31 | 3,622.007 | 2,690.634 | 1,810.758 |
2021-12-31 | 3,415.824 | 2,543.555 | 1,732.444 |
2021-09-30 | 3,250.552 | 2,327.282 | 1,466.552 |
PSA's Quality Factors
The “Quality” component of the POWR Ratings focuses on 31 different factors of a companies fundamentals and operational strength. Here are some key insights as we drill into the specifics of these quality attributes.- PSA has a Quality Grade of C, ranking ahead of 72.65% of graded US stocks.
- PSA's asset turnover comes in at 0.243 -- ranking 81st of 444 Trading stocks.
- SACH, CTT, and NXRT are the stocks whose asset turnover ratios are most correlated with PSA.
The table below shows PSA's key quality metrics over time.
Period | Asset Turnover | Gross Margin | ROIC |
---|---|---|---|
2021-09-30 | 0.243 | 0.726 | 0.105 |
2021-06-30 | 0.249 | 0.718 | 0.105 |
2021-03-31 | 0.250 | 0.704 | 0.107 |
2020-12-31 | 0.246 | 0.702 | 0.105 |
2020-09-30 | 0.245 | 0.710 | 0.110 |
2020-06-30 | 0.245 | 0.711 | 0.117 |
PSA Price Target
For more insight on analysts targets of PSA, see our PSA price target page. And for a list of of all stocks sorted by upside potential based on analyst target price, see our Top Price Target page.
Average Price Target | $333.43 | Average Broker Recommendation | 1.81 (Hold) |
Public Storage (PSA) Company Bio
Public Storage is an American international self storage company headquartered in Glendale, California, that is run as a real estate investment trust (REIT). It is the largest brand of self-storage services in the US.[4] In 2008, it was the largest of four publicly traded storage REITs.[5] There are more than 2,200 Public Storage self-storage locations in the US, Canada and Europe. It also owns 42 percent of an office parks subsidiary, sells packing supplies, and provides other services. As a REIT, it is owned by real estate investors, who receive more than 90 percent of the company's profits as a return-on-investment. (Source:Wikipedia)
Latest PSA News From Around the Web
Below are the latest news stories about PUBLIC STORAGE that investors may wish to consider to help them evaluate PSA as an investment opportunity.
Buying $1,000 of These Dividend Stocks Could Supply Passive Income ForeverInvesting in real estate is a great way to collect passive income. Anyone can invest in real estate investment trusts (REITs) and receive dividend income. Invitation Homes (NYSE: INVH), Public Storage (NYSE: PSA), and W. P. Carey (NYSE: WPC) are great ways to begin building your real estate empire through REITs. |
3 REITs to Buy for Steady IncomeWhen investors start looking for the best REITs for income, here are three stocks they should start with for consistent income. |
Public Storage (NYSE:PSA) Q1 2023 Earnings Call TranscriptPublic Storage (NYSE:PSA) Q1 2023 Earnings Call Transcript May 4, 2023 Operator: Ladies and gentlemen, thank you for standing by, and welcome to the Public Storage First Quarter 2023 Earnings Call. At this time, all participants have been placed in a listen-only mode and the floor will be opened for your questions following the presentation. […] |
Jones Lang LaSalle (JLL) Q1 Earnings Miss, Revenues Fall Y/YJones Lang LaSalle (JLL) Q1 earnings lag estimates on poor transaction-based businesses' performance as higher interest rates and macroeconomic uncertainty lead to lower transaction volumes. |
Q1 2023 Public Storage Earnings CallQ1 2023 Public Storage Earnings Call |
PSA Price Returns
1-mo | -5.83% |
3-mo | -4.31% |
6-mo | -4.29% |
1-year | -9.22% |
3-year | 54.60% |
5-year | 58.52% |
YTD | 0.98% |
2022 | -20.20% |
2021 | 66.63% |
2020 | 12.69% |
2019 | 8.96% |
2018 | 0.62% |
PSA Dividends
Ex-Dividend Date | Type | Payout Amount | Change | ||||||
---|---|---|---|---|---|---|---|---|---|
Loading, please wait... |
Continue Researching PSA
Want to see what other sources are saying about Public Storage's financials and stock price? Try the links below:Public Storage (PSA) Stock Price | Nasdaq
Public Storage (PSA) Stock Quote, History and News - Yahoo Finance
Public Storage (PSA) Stock Price and Basic Information | MarketWatch
Loading social stream, please wait...