Shopify Inc. Cl A (SHOP): Price and Financial Metrics
SHOP Price/Volume Stats
Current price | $53.08 | 52-week high | $71.43 |
Prev. close | $53.70 | 52-week low | $23.63 |
Day low | $52.89 | Volume | 9,860,320 |
Day high | $55.27 | Avg. volume | 15,620,296 |
50-day MA | $60.77 | Dividend yield | N/A |
200-day MA | $52.20 | Market Cap | 68.07B |
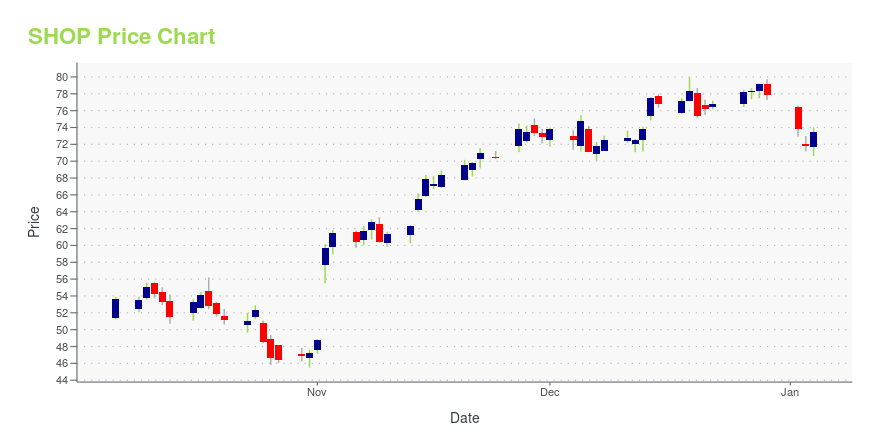
SHOP Stock Price Chart Interactive Chart >
SHOP POWR Grades
- Sentiment is the dimension where SHOP ranks best; there it ranks ahead of 75.54% of US stocks.
- SHOP's strongest trending metric is Momentum; it's been moving up over the last 178 days.
- SHOP's current lowest rank is in the Value metric (where it is better than 8.58% of US stocks).
SHOP Stock Summary
- SHOP has a market capitalization of $84,459,588,535 -- more than approximately 97.4% of US stocks.
- Price to trailing twelve month operating cash flow for SHOP is currently 4,935.69, higher than 99.93% of US stocks with positive operating cash flow.
- In terms of twelve month growth in earnings before interest and taxes, SHOPIFY INC is reporting a growth rate of -1,654.31%; that's higher than only 1.24% of US stocks.
- Stocks with similar financial metrics, market capitalization, and price volatility to SHOPIFY INC are FLYW, CYRX, MX, MASI, and MDB.
- Visit SHOP's SEC page to see the company's official filings. To visit the company's web site, go to www.shopify.com.
SHOP Valuation Summary
- SHOP's price/sales ratio is 14.3; this is 410.71% higher than that of the median Technology stock.
- Over the past 100 months, SHOP's EV/EBIT ratio has gone up 39.2.
Below are key valuation metrics over time for SHOP.
Stock | Date | P/S | P/B | P/E | EV/EBIT |
---|---|---|---|---|---|
SHOP | 2023-07-24 | 14.3 | 10.0 | -44.1 | -44.6 |
SHOP | 2023-07-21 | 14.2 | 9.9 | -43.7 | -44.2 |
SHOP | 2023-07-20 | 14.2 | 9.9 | -43.6 | -44.1 |
SHOP | 2023-07-19 | 14.8 | 10.3 | -45.5 | -46.0 |
SHOP | 2023-07-18 | 14.6 | 10.2 | -44.8 | -45.3 |
SHOP | 2023-07-17 | 14.9 | 10.4 | -45.8 | -46.3 |
SHOP Growth Metrics
- Its year over year revenue growth rate is now at 39.98%.
- The 2 year net income to common stockholders growth rate now stands at 237.61%.
- Its 5 year revenue growth rate is now at 289.13%.

The table below shows SHOP's growth in key financial areas (numbers in millions of US dollars).
Date | Revenue | Operating Cash Flow | Net Income to Common Stock |
---|---|---|---|
2022-12-31 | 5,599.864 | -136.448 | -3,460.418 |
2022-12-31 | 5,599.864 | -136.448 | -3,460.418 |
2022-09-30 | 5,244.91 | -131.375 | -3,208.035 |
2022-06-30 | 5,002.45 | 124.597 | -1,901.194 |
2022-03-31 | 4,826.832 | 315.185 | 181.806 |
2021-12-31 | 4,611.856 | 504.428 | 2,914.659 |
SHOP's Quality Factors
The “Quality” component of the POWR Ratings focuses on 31 different factors of a companies fundamentals and operational strength. Here are some key insights as we drill into the specifics of these quality attributes.- SHOP has a Quality Grade of C, ranking ahead of 56.26% of graded US stocks.
- SHOP's asset turnover comes in at 0.382 -- ranking 385th of 563 Business Services stocks.
- ALRM, ISSC, and TYL are the stocks whose asset turnover ratios are most correlated with SHOP.
The table below shows SHOP's key quality metrics over time.
Period | Asset Turnover | Gross Margin | ROIC |
---|---|---|---|
2021-09-30 | 0.382 | 0.545 | 0.437 |
2021-06-30 | 0.406 | 0.542 | 0.378 |
2021-03-31 | 0.443 | 0.535 | 0.331 |
2020-12-31 | 0.492 | 0.526 | 0.071 |
2020-12-31 | 0.492 | 0.526 | 0.071 |
2020-09-30 | 0.503 | 0.530 | 0.041 |
Shopify Inc. Cl A (SHOP) Company Bio
Shopify Inc. allows Merchants to use its software to design, set up and manage their stores across multiple sales channels, including web, mobile, social media, brick-and-mortar locations, and pop-up shops. The company was founded in 2004 and is based in Ottawa, Canada.
Latest SHOP News From Around the Web
Below are the latest news stories about SHOPIFY INC that investors may wish to consider to help them evaluate SHOP as an investment opportunity.
Shopify Stock’s Next Move: Will It Be a Pop or a Drop?Up by nearly 75% year-to-date, can SHOP stock maintain the momentum, and climb back further towards prior price levels? |
Shopify (SHOP) Dips More Than Broader Markets: What You Should KnowShopify (SHOP) closed the most recent trading day at $58.33, moving -1.97% from the previous trading session. |
Shopify (SHOP): A Smart Investment or a Value Trap? An In-Depth ExplorationNavigating the thin line between value and trap with Shopify Inc (SHOP) |
25 Passive Income Ideas to Make Money & Build Wealth in 2023In this article, we discuss 25 passive income ideas to make money & build wealth in 2023. You can skip our detailed analysis of passive income and its benefits in today’s world, and go directly to read 5 Passive Income Ideas to Make Money & Build Wealth in 2023. The concept of passive income is […] |
3 Phenomenal Stock-Split Stocks You Should Be Buying NowThese three fantastic stock-split stocks are stocks investors should be buying in the wake of last year's wave of splits. |
SHOP Price Returns
1-mo | -6.43% |
3-mo | -16.79% |
6-mo | 18.01% |
1-year | 85.79% |
3-year | -44.38% |
5-year | 228.63% |
YTD | 52.92% |
2022 | -74.80% |
2021 | 21.68% |
2020 | 184.71% |
2019 | 187.17% |
2018 | 37.08% |
Continue Researching SHOP
Here are a few links from around the web to help you further your research on Shopify Inc's stock as an investment opportunity:Shopify Inc (SHOP) Stock Price | Nasdaq
Shopify Inc (SHOP) Stock Quote, History and News - Yahoo Finance
Shopify Inc (SHOP) Stock Price and Basic Information | MarketWatch
Loading social stream, please wait...