Ubiquiti Inc (UI): Price and Financial Metrics
UI Price/Volume Stats
| Current price | $435.10 | 52-week high | $469.98 |
| Prev. close | $420.77 | 52-week low | $139.06 |
| Day low | $419.37 | Volume | 66,573 |
| Day high | $437.08 | Avg. volume | 102,742 |
| 50-day MA | $327.89 | Dividend yield | 0.57% |
| 200-day MA | $298.93 | Market Cap | 26.32B |
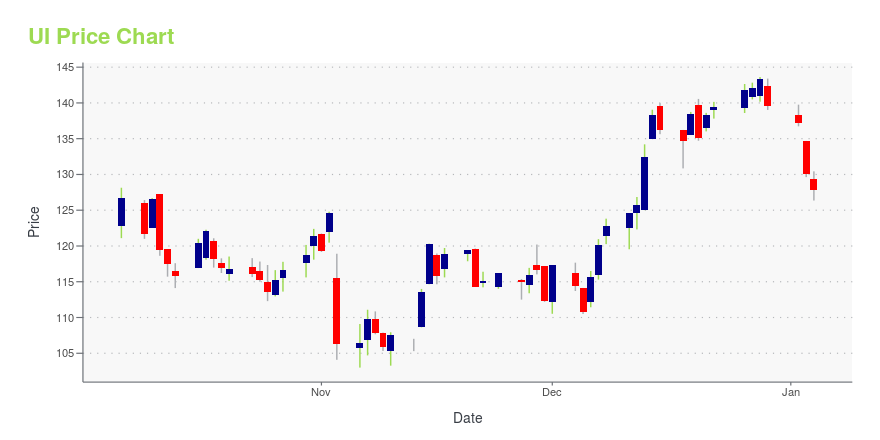
UI Stock Price Chart Interactive Chart >
Ubiquiti Inc (UI) Company Bio
Ubiquiti Inc. (formerly Ubiquiti Networks, Inc.) is an American technology company founded in San Jose, California, in 2003. Now based in New York City, Ubiquiti manufactures and sells wireless data communication and wired products for enterprises and homes under multiple brand names. On October 13, 2011, Ubiquiti had its initial public offering (IPO) at 7.04 million shares, at $15 per share, raising $30.5 million. (Source:Wikipedia)
UI Price Returns
| 1-mo | 41.94% |
| 3-mo | 27.74% |
| 6-mo | 30.29% |
| 1-year | 209.65% |
| 3-year | 78.84% |
| 5-year | 164.89% |
| YTD | 31.31% |
| 2024 | 141.15% |
| 2023 | -48.23% |
| 2022 | -9.80% |
| 2021 | 10.83% |
| 2020 | 48.49% |
UI Dividends
| Ex-Dividend Date | Type | Payout Amount | Change | ||||||
|---|---|---|---|---|---|---|---|---|---|
| Loading, please wait... | |||||||||


Loading social stream, please wait...