

I think we can all agree that periods of intense market volatility, such as this current correction (the second of the year) are nerve-wracking. Even long-term value-focused contrarian investors like me sometimes get rattled when stocks fall fast and hard.
But given that we’re now seeing such incredible fear, uncertainty and doubt on Wall Street, it’s important that you not let the market’s declines nor the hyperbolic media panic you into making a costly mistake. So let’s look at three important lies that are very popular today, but could cost you a fortune if you let them shake you from your long-term investing plan.
Lie 1: This Is Unusually High Market Volatility
Stocks continued to be rocked by volatility down nearly 3% as I write this after falling 3.2% on Tuesday, December 4th. That puts us back at 10.2% from the S&P 500s September 20th all-time high, the last low we reached two weeks ago. Many investors feel this is an unusual amount of volatility, thus possibly giving credence to the idea that “this time is different” and that we might even be in a bear market. Heck, even Wall Street veterans like Jim Cramer, who has been through plenty of market cycles in his day, are stoking such fears.
“I have tremendous contempt for this market, because every time you try to make money with it, it cuts your heart out. That’s a bear market,”- Jim Cramer, CNBC Nov 26th, 2018
With respect to Mr. Cramer, this is NOT a bear market (20+% close below S&P 500’s all-time high). Nor is it necessarily likely to become one.
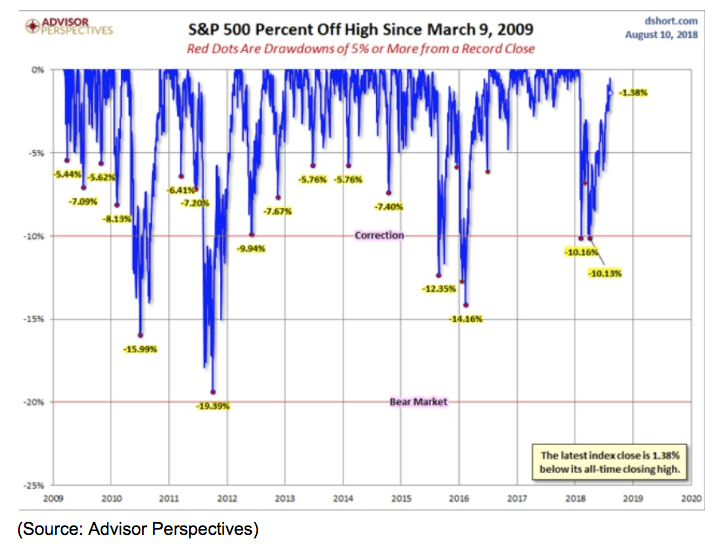
Since bottoming in March 2009 the stock market has seen plenty of pullbacks (5% to 9.9% declines) and corrections. In 2011 we even came within a stone’s throw of an actual bear market. Each correction is associated with its own market fears, specifically obsessing over risks to the economic and earnings fundamentals that ultimately determine share prices.
In 2011 it was fears over the European Sovereign debt crisis and the US debt ceiling showdown (US lost its AAA credit rating from S&P) that was supposed to plunge the world back into recession and send earnings tanking. In 2015 (a year which saw two corrections) it was fears over China’s slowing growth, rising interest rates, and crashing oil prices (sound familiar?)
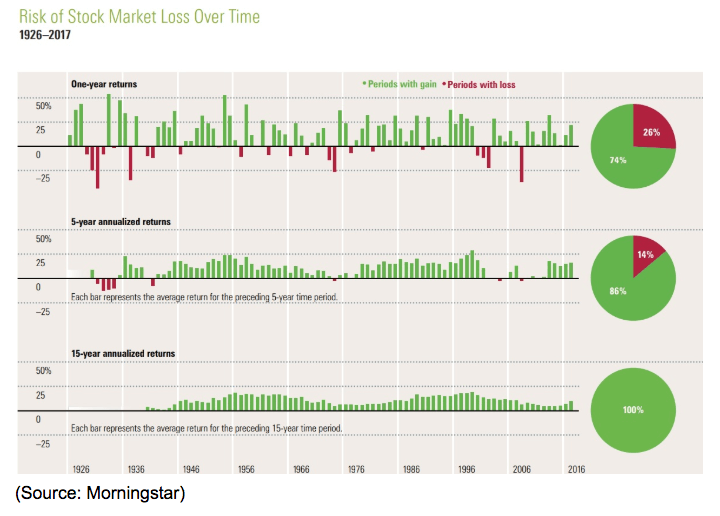
Now the market’s “wall of worry” is once more about Fed rate hikes, slowing growth (due to the trade war which is likely to end by February) and overall slowing global growth rates (plus a yield curve inversion in the US). But guess what? The stock market has generated 9.2% CAGR total returns since 1871 through far worse events than these current risks. We’ve suffered depressions, World Wars, killer flu pandemics (1918 Spanish flu killed 5% of the world’s population), and numerous recessions and financial crises. Unless you think the world is literally going to end it’s almost certain that the stock market will be higher over the next five to 15 years.
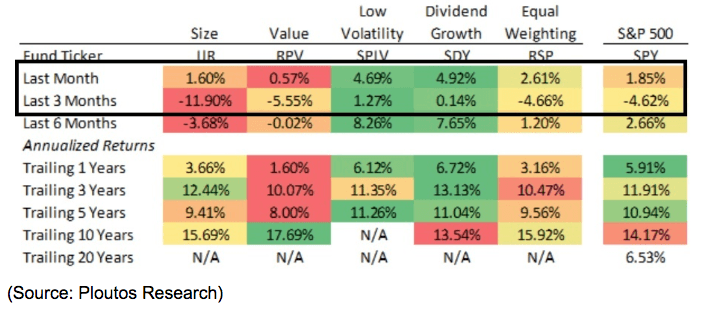
And in the meantime, there are plenty of investing strategies you can use that have proven to outperform the market over time, and with lower volatility during downturns.
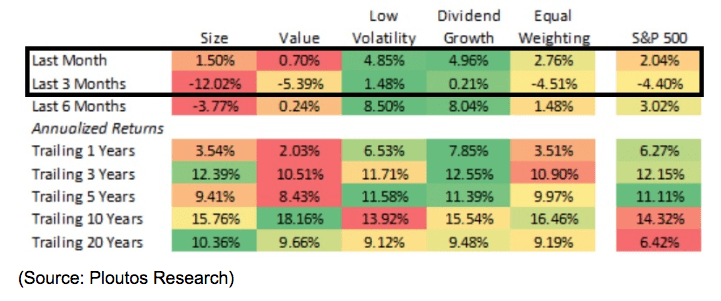
During this correction low volatility stocks and dividend growth stocks (my personal investing strategy) have crushed the market. If you are a passive investor then you can use low-cost ETFs to invest in these “smart beta” strategies.
But what about all the claims that the bull market is too old to survive any longer? After all, it’s now the longest bull market in history (in its 10th year) and we’re due for a bear market right? Actually, that’s not true either.
Lie 2: Rising Risks Mean This Is Likely a Bear Market
“Bull markets are born on pessimism, grow on skepticism, mature on optimism and die on euphoria.” – Sir John Templeton, Founder Templeton Funds
I like to remind investors of this famous quote from John Templeton because the very correction we’re now in makes a bear market less likely to actually happen. On September 20th the market was not a sea of euphoric investors who were blindly buying into stocks out of “fear of missing out” or FOMO. Bull market tops typically see bears silenced and grudgingly buying stocks because “there is no alternative” or TINA. On September 20th you could reliably find the financial media eagerly discussing all the reasons the market might crash. Perma-bears like John Hussman, who has been predicting a 65% market crash since 2010, continued to proclaim a great bloodbath for investors is just around the corner.
But what about all the very real risks that we’re facing like Fed rate hikes and the trade war? Well, let’s actually apply some logic and look at the facts. Thanks to this third leg down in this correction we’re back to -10.2% from all-time highs. That’s the same level as two weeks ago.
Back then the risks of the Fed raising rates too far, too fast and tipping the US into a recession were far greater than they are today. 2 weeks ago the Fed was still on track for five or even six more rate hikes by the end of 2020. Last week both Fed chairman Jerome Powell and the Fed’s November minutes confirmed that we’re only certain to get one more rate hike (December) and then the Fed will consider pausing or even canceling any future hikes depending on how the inflation and macroeconomic data. Today the bond futures market is pricing in just 2 more rate hikes before the Fed stops hiking this economic cycle. Might the bond market be wrong about that? Sure, but the point is that last week the Fed officially threw the dot plot out the window and so the risk of “hiking until something breaks” is objectively less than it was the last time stocks fell to these levels.
Now let’s talk trade war. Two weeks ago Wall Street was terrified that the US would raise tariffs on $200 billion of Chinese imports from 10% to 25% on January 1st, and possibly impose 25% tariffs on the remaining $267 billion by mid-February. At the G20 meeting, a three-month trade war truce was struck, in which no additional tariffs would go into effect (or rate increases) until at least March 1st (which Trump recently said he might extend).
What about Trump’s now famous “tariff man” tweet which is largely blamed for November 4th’s 3.2% plunge in the S&P 500 (Dow fell 800 points)? Well, the market is forgetting that before his declaring himself the “tariff man” Trump also said about the trade deal “we will get it done. China is supposed to start buying agricultural products and more immediately. President Xi and I want this deal to happen, and it probably will.” Only after telling us that a deal was more likely to happen than not (greater than 50% probability) did Trump go off on one of his typical campaign-style stump tweets:
“But if not remember, I am a Tariff Man. When people or countries come in to raid the great wealth of our Nation, I want them to pay for the privilege of doing so. It will always be the best way to max out our economic power. We are right now taking in $billions in Tariffs. MAKE AMERICA RICH AGAIN…..But if a fair deal is able to be made with China, one that does all of the many things we know must be finally done, I will happily sign. Let the negotiations begin. MAKE AMERICA GREAT AGAIN!” – Trump
Since it’s US companies and consumers paying the tariffs it’s safe to assume that Trump’s claims that a trade war will “make America Rich Again” is typical hyperbole one sees from a politician in campaign mode. Meanwhile, even in that infamous tweet, Trump makes clear that he’s looking to strike a deal. Remember that he ran on being the “deal maker in chief” and promised a great trade deal with China. Despite his tough talk about cracking the whip on all US trading partners (and possibly pulling the US out of NAFTA) the US has now struck trade deals with South Korea, Canada, and Mexico, and is in final preparations for new deals with Japan and the EU. With 2020 fast approaching Trump needs a strong economy with a great labor market and strong wage growth to win.
While the trade war anecdotes are coming fast and furious the point is that the risks of our worst fears (25% tariffs on all Chinese imports by early 2019) are now substantially reduced. One can agonize over Trumps numerous and often contradictory statements and tweets, but the fact that no 25% tariff increase is coming January 1st certainly reduces trade war risk compared to two weeks ago, the last time stocks fell this low.
Which brings me to the most important point about both Fed rate hike and trade war risk. That the very fact that the market is freaking out over it is very likely the reason the Fed has switched to its new dovish mode and Trump struck a truce deal at the G20. President Trump is especially sensitive to the stock market, even going so far as to mention the strong 2017 rally in his last State of the Union declaring it evidence that his policies were working.
How would it look if Trump, the CEO in chief, were to see the longest bull market in US history end…over a trade war, he chose to initiate over the objections of the vast majority of economists, advisors, and corporate executives? Trump is already running for re-election and wants the bull market to remain alive and well. If stocks were to continue sliding (current macro fundamentals, valuations, and earnings don’t support a full-blown bear market) then the chances of Trump not striking a deal with China (even if it’s not exactly what he wants) go way down.
What about the Fed? Well, Powell has said that the Fed isn’t so much concerned with the stock market as much as the bond market. Specifically, the flattening yield curve that has fallen below zero (inverted) before every recession since 1955. But doesn’t that flattening yield curve mean this time really could be different and that a bear market is now upon us? While that MIGHT be true, here’s why it likely isn’t.
Lie 3: The Yield Curve Inverting This Week Means A Recession Is Coming Soon
While it’s true that the yield curve inverting is the most accurate recession predictor ever discovered, that doesn’t mean that the media’s recent hyping of the 2/5 and 3/5 curves inverting December 4th and December 3rd, respectively, is accurate. There are dozens of yield curves (yield difference between different duration treasury bonds) but not all are equally good predictors of recessions.
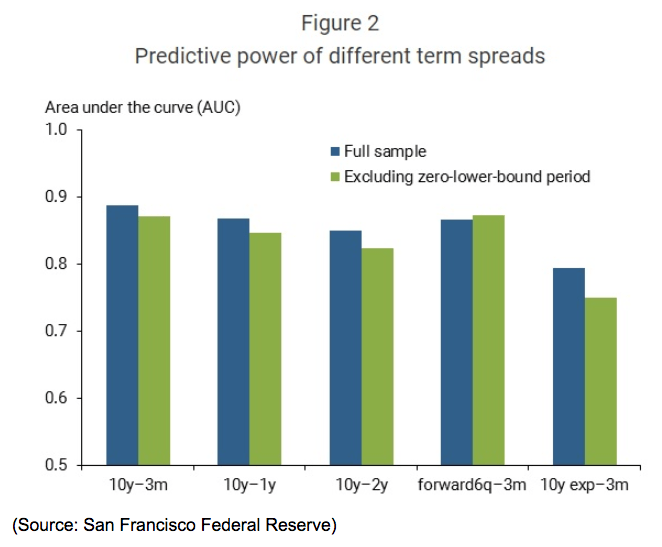
According to an August 2018 study by the San Fran Fed, the longer the duration difference between yield curves the more accurate they are at predicting recessions. This is why the 10 year-3 month curve is more accurate than the 10y-1y curve which is more accurate than the 10y-2y curve. And according to the study “The yield curve has been a reliable predictor of recessions, and the best summary measure is the spread between the ten-year and three-month yields.”
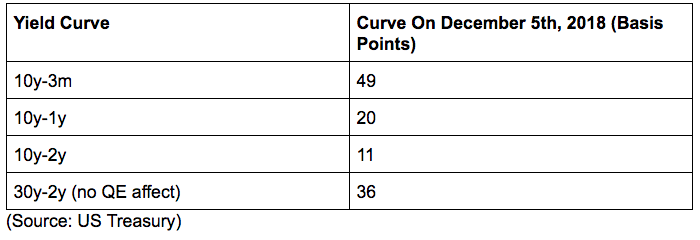
The 10y-2y curve is the most popular one tracked in the media (and the most studied). But it remains positive. The more accurate curves, including the 30y-2y one (which has not been affected by the Fed’s massive bond-buying over the past decade which artificially flattened the curves involving the 10 year-yield) remain a good distance from inversion.
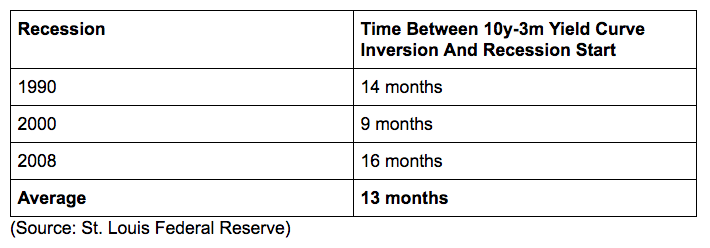
Remember that a flat curve is meaningless. The yield curve’s predictive recession power is binary. If the curve is positive then there is little recession risk. If it’s negative, then the recession countdown clock begins ticking down. Right now the most accurate yield curve, the 10y-3m, remains the furthest from inverting signaling that current recession fears are way overblown. At its current rate of flattening (since peaking in January 2010) the 10y-3m curve would take another 17 months to invert (May 2020). At which point a recession would be likely to begin within nine to 16 months (January 2021 to August 2021, most likely May 2021).
And keep in mind that this calculation (time to inversion) already bakes in the 0.3% decline in the yield curve over just the past few weeks (a historically unsustainable pace of decline). The curve has fallen so fast because of an epic rally in 10-year bonds that is unlikely to continue. That’s because, bonds, like stocks, never go straight up. The current melt-up in 10-year bond prices is being driven by both a flight to safety but also computer-based algorithms (it also involves a big short-squeeze). Most likely the 10-year yield will end up bottoming relatively soon and rallying significantly, thus pushing off a 10y-3m inversion even more.
What if the market panic causes the curve to invert anyway (fear of inversion resulting in rampant bond buying causing the very inversion investors fear)? Well, that could happen. BUT if the yield curve rises back above zero (rallies) then the recession countdown clock is reset. In other words, what matters the most in terms of recession prediction is the 10y-3m curve inverting AND staying inverted.
That’s not even close to happening right now and lines up with all the economic data I track each week in my economic updates. Basically, this means that given both the most accurate yield curve, and the current economic trends, a recession is most likely to start 23 to 30 months from now, NOT next year. What about the start of a bear market? Well, that’s tougher to estimate but historically the S&P 500 tops about 8 to 13 months after an inversion.
- Likely Recession Start range: January 2021 to August 2021
- Likely Bear Market Start range: December 2019 to May 2020
These are my best probabilistic estimates of the start of the next recession and bear market. Of course, historical data and long-term trend extrapolation can only be so accurate, but I’m reasonably confident (enough to hold 100% of my life savings in stocks) that we’re NOT in a bear market right now.
And let’s not forget that the Fed rates hikes are a key reason short-term rates (like 3-month treasuries) have been rising fast and flattening the yield curve in the first place. Let’s say that one or more of the important curves, like the 10y-2y and 10y-1y curves, invert very soon, like next week. The Fed is scheduled to hike rates on December 19th. If one or more important curves are inverted by, and the stock market is close to a bear market as a result, then it becomes far more likely that the Fed doesn’t hike rates at all. In fact, as I write this the 10y-2y yield curve is actually UP 2 basis points because while 10-year yields are down 8 bp (flight to safety) 2-year yields are down 10 bp. The bond market is signaling that the market slide alone might be enough to cause the Fed to stop hiking rates even one more time. That itself would likely be enough good news to snap the market’s losing streak and put a bottom under stocks thus avoiding a bear market that is NOT supported by the current economic or earnings fundamentals.
Bottom Line: Don’t Believe the Media’s Hype About Economic And Stock Market Crashes
Currently, the US economy is on track to grow at 2.9% or possibly even 3% in 2018, and 2.5% to 2.7% in 2019 (even factoring in a trade war that doesn’t end in February). The global economy is expected to grow 3.7% this year and 3.5% next year (slower growth due to trade war). Slowing growth (including in corporate earnings) is NOT the same as negative growth.
Current market valuations are reasonable by historical standards (given our current long-term interest rates) and those valuations continue to improve as earnings are growing at over 20% this year while stocks are mired in this correction. In order for a bear market to be justified by fundamentals and valuations, it would take negative economic and earnings growth next year, which the economist and analyst consensus is NOT expecting (9% EPS growth next year and 9% to 9.5% in 2020).
And given that the Fed and Trump have shown themselves to be attuned to the market’s signaling of “for the love of god STOP what you’re doing!” the further the market falls in this run of the mill correction, the lower the risks the market is obsessing over actually have of happening.
The bottom line is that the actual facts about all the important things the market is worried over, (interest rates, the trade war, earnings growth, the economy, the yield curve) do not actually support the market falling even 10% more, much less 24% (historical average bear market since WII), or the 40% to 55% that some doomsday bears have been warning about for nearly a decade now.
That means that the best thing you can do is stay calm, buy stocks if you have the cash, and just ignore your portfolio if you don’t. The absolute worst thing you can do is give into panic and allow emotions, rather than logic and reason, to guide your portfolio’s decisions right now.
About the Author:

9 "Must Own" Growth Stocks For 2019
Get Free Updates
Join thousands of investors who get the latest news, insights and top rated picks from StockNews.com!
Top Stories on StockNews.com

Best & Worst Performing Stock Industries for July 26, 2024
Led by ticker KGJI, "Fashion & Luxury" was our best performing stock industry of the day, with a 1,299.75% gain.
Best & Worst Performing Mid Cap Stocks for July 26, 2024
GSHD leads the way today as the best performing mid cap stock, closing up 29.21%.
Best & Worst Performing Small Cap Stocks for July 26, 2024
KGJI leads the way today as the best performing small cap stock, closing up 100,000.00%.
Best & Worst Performing Large Cap Stocks for July 26, 2024
NOW leads the way today as the best performing large cap stock, closing up 13.40%.