

I think we can all agree that investors have been rattled by high volatility over the last few months. Consider
- In December the S&P 500 plunged 17% in three weeks and fell into the worst correction since 2009.
- In December the high volatility Nasdaq crashes into a bear market (22% below its all-time high)
- Q1 2019 saw the strongest rally in 32 years
- Last month’s swoon was the worst May for stocks in 10 years and the 2nd worst since the 1960s
- June has seen the market rally 6% to within 2% of its all-time high
It’s understandable that many investors are feeling a bit of whiplash from these apparently strong and violent swings in prices. Most of that is tied to sentiment/rumors/expectations surrounding US trade, the Federal Reserve’s interest rate policies and ultimately whether or not we’re likely to get a recession in late 2019 or 2020.
Since 1946 no recession has ever NOT resulted in a bear market, with average declines of 30%, even excluding the historical anomalies of the 2000 tech crash (the biggest valuation bubble in history) and the Great Recession (the second worst financial crisis in history).
Thus it’s understandable that many investors might feel like stockpiling a lot of cash is the prudent thing to do. While that may be true if you have very little risk tolerance (for your personal goals/time horizon) here are the three reasons why I am personally not worried about a recession, at least enough to stop buying undervalued blue-chip dividend stocks on a weekly basis.
Reason 1: You Can’t Look at ANY Single Indicator in Isolation
The media LOVES to drum up attention (to better sell ads) by hyping scary-sounding headlines about imminent recessions and bear markets. And it’s not hard to do since you can always cherry-pick several weak economic reports or model predictions that make it sound like the next great economic downturn/market crash is right around the corner.
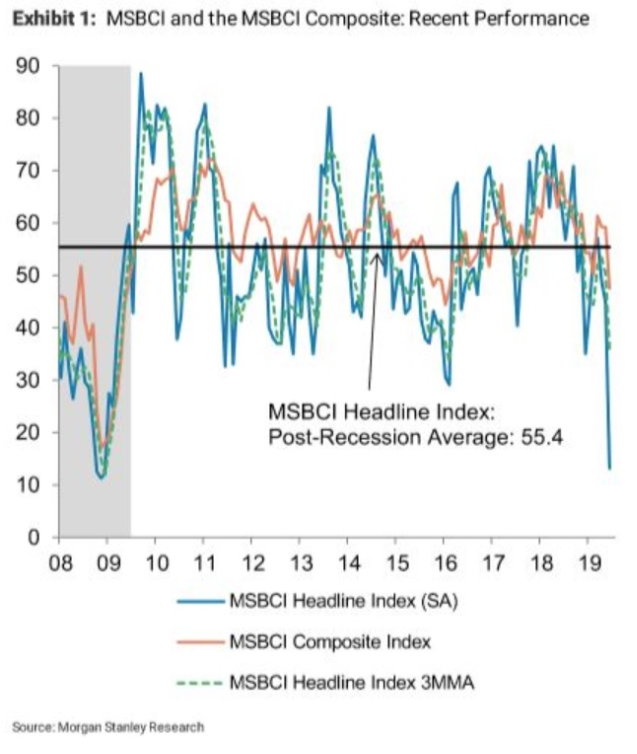
For example, Morgan Stanley’s proprietary business condition index or BCI, did, in fact, suffer its worst single month decline ever in June, and plunged to levels not seen since late 2008.
And it’s also true that based on the BCI, as well as Morgan’s proprietary “adjusted-yield curve” (which attempts to factor out Fed bond buying of the last decade) the recession clock is officially ticking. That’s because according to Morgan’s estimates, the yield curve, factoring in QE’s effects on bond yields, actually inverted in November and has been inverted for more than six straight months. Never in US history has that happened and a recession not followed within 12 to 24 months.
Now I actually don’t disagree entirely with Morgan about the fact that growth is likely to be much slower. Nor do I disagree that 6 months of yield curve inversion isn’t significant. As I explain in the conclusion, I actually use Morgan’s 6-month inversion confirmation as part of my own recession capital allocation plan (one of 5 recession confirmation signals I use).
However, the thing to remember about the economy is that there are no less than 19 leading economic indicators (with time tested recession predicting power) and rather than looking at just a few of them, we need to step back and consider the bigger picture.
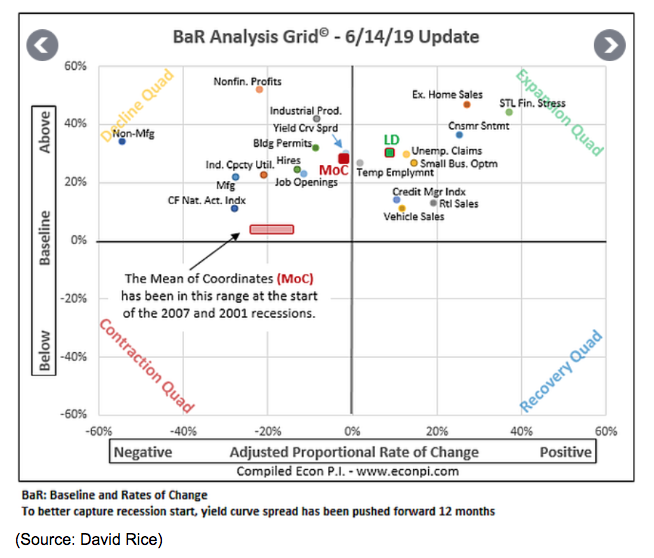
This is why I consider David Rice’s (aka “Economic Pi”) BaR economic grid to be one of the most valuable tools for tracking the economy. Using the three decades of economic data (and the last four recessions) Mr. Rice has calculated what the baseline level for each indicator is over time (the last three decades) and how low they sink throughout the economic cycle (including recessions). The red box is where the mean of coordinates (red dot) was before the 2000 and 2007 recessions. As you can see the MoC is nowhere close to signaling an imminent recession yet. And the leading indicator dot (green dot), which indicates where the MoC is likely to go next, is actually back in the expansion quadrant and slightly higher above baseline.
In other words, over the last few weeks, the economic data, all told, appears to be getting slightly better, and NOT pointing to a recession (merely a 2015/2016 style slowdown).
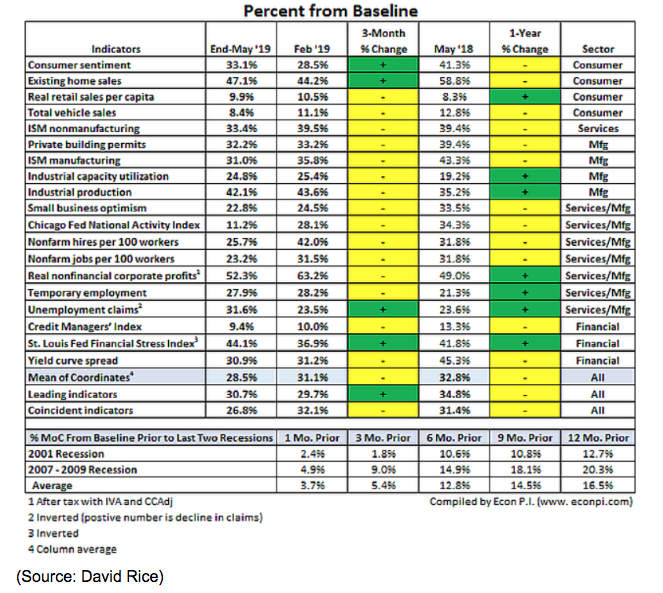
And for those who love to see granular data Mr. Rice breaks it down even more for us. Specifically, look at where the MoC was (in terms of baseline) 1 month to 12 months before the last two recessions. At the end of May, which includes the big tariff induced market sell-off, the MoC was 28.5% above baseline and the leading indicator average was 30.7% above baseline. Those are levels high enough that, historically speaking, we’re unlikely to see a recession begin within the next year.
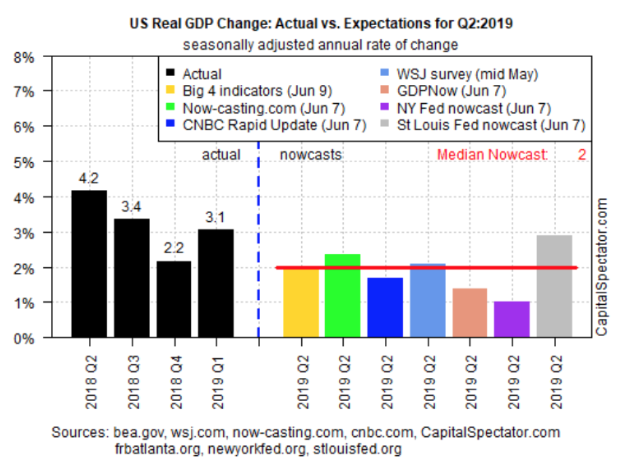
Similarly, last week’s economic data was actually mostly positive, which caused the median consensus of no less than eight real-time GDP growth models to rise 0.2% to predict 2% GDP growth in Q2. The New York Fed’s model is also now predicting similar growth in Q3.
2% growth is far from exciting, and down about 50% from last year’s tax cut/stimulus-induced 2.9% levels. But slower growth is still growth, and thus not an indication that we’re headed for 2007-2009 style economic downturn, and certainly not a Financial Crisis like stock market plunge.
Reason 2: The Main Cause of the Slowdown is the Trade War Which Could End Relatively Quickly
There isn’t much debate about what’s causing recession risk (about 40% right now) to rise, or what’s causing most of the market’s heightened volatility…it’s the trade war. But the good news is that what one negative factor can cause, so too can the removal of that factor significantly reduce the very risks that have so many people losing sleep right now.
As Marko Kolanovic, J.P. Morgan’s global head of quantitative and derivatives strategy wrote in a note to clients last week:
“The U.S. economy is facing a quite unique situation in which one individual can disrupt global trade and investment plans of U.S. corporations, tax consumers on a broad range of imports, etc…Given all of this — why are we not bearish on equities and the economy? Because this situation can also be undone on short notice and many market segments already price in worst-case outcomes…This would translate into a quick [approximately] 5% rally in broad markets, and a 10-20% rally in value and high beta. As a strong market and avoiding a recession would boost re-election odds, it would only be rational to expect this outcome.” – JPMorgan
JPMorgan is actually expecting a trade deal will be struck in late 2019 or early 2020, resulting in a modest market rally. But note that undervalued stocks and high volatility/trade sensitive names (such as chip makers, energy, and financials) could see a 10% to 20% rally when that high probability outcome occurs.
This is why I’ve been investing tens of thousands of dollars in recent weeks into deeply undervalued chip makers and other trade/economically sensitive names. Now is it possible that President Trump isn’t going to live up to JPMorgan’s expectations and follow a “rational” course? Certainly, you can never assume that any politician is going to have a Vulcan-like devotion to logic, especially not one whose proven as volatile as Trump.
But ultimately, while we can’t know what’s really motivating the President’s trade decisions, one thing seems all but certain. He wants to win in 2020 and he knows that the odds of that happening are MUCH higher if the economy is growing around 2% then if we’re near zero growth and risking a recession. Thus I agree with JPM that the most likely outcome is a trade deal within the next few months, that greatly reduces recession risk and just creates “the great recession scare of 2019”.
Reason 3: Don’t Forget the Fed Has Plenty of Ammo to Stimulate the Economy
The biggest “flashing red light” when it comes to recession risks has been the yield curve which inverted on March 23rd and has since inverted twice more.
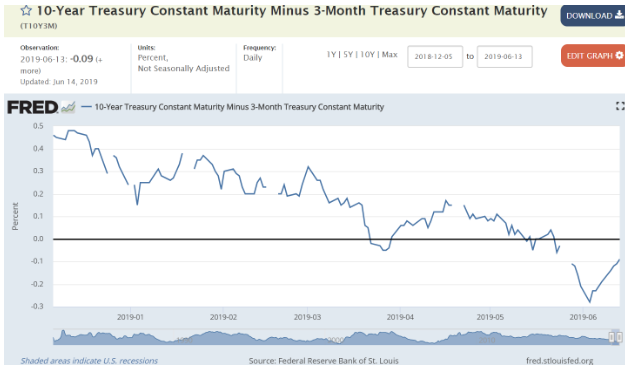
As you can see the first two times were very brief and shallow inversions but this third one has been far longer (now in its third week) and deeper. We got as low as -28 basis points but the curve has been steadily climbing higher over the past week and sits at -7 basis points as I write this (up another 2 bp relative to June 13th).
But it’s important to remember that an inverted yield curve by itself doesn’t indicate a recession is necessarily a sure thing.
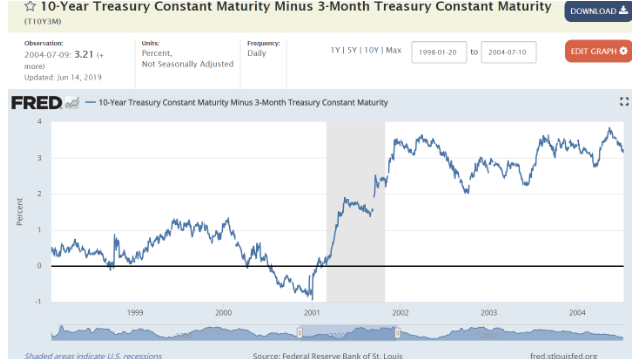
The 2001 recession was preceded by a 6-month inversion that saw the curve fall to almost -100 basis points. The 2007-2009 recession that so many fear might be returning, saw a 1-year inversion as deep as 63 basis points.
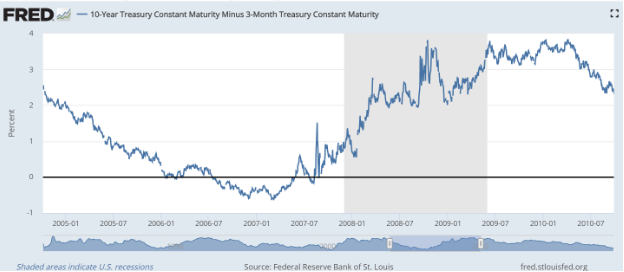
What we’ve seen so far isn’t close, either in duration or severity. Why is the bond market, the most accurate recession forecaster every discovered, apparently getting steadily less afraid of recession? Most likely because of confidence that Fed rate cuts can prevent a recession.
My interpretation of the yield curve over the past few weeks is this.
- If the Fed does nothing then recession in 2020 is very likely
- If the Fed cuts at least twice, then the curve un-inverts and recession becomes the lower probability event
Moody’s Analytics estimates that each 25 basis point cut to the Fed Funds Rate (which has a strong effect on short-term rates) would boost GDP growth by 0.1% to 0.15% within 12 months. This means that 8 rate cuts (back to zero) would likely boost US growth by about 1%.
Is it possible the Fed might not act fast enough? You bet, historically that’s what happens. And is it possible the bond market is wrong about how many times the Fed is likely to cut? Sure, that’s been the case over the past 10 decades, according to a recent report from Deutsche Bank.
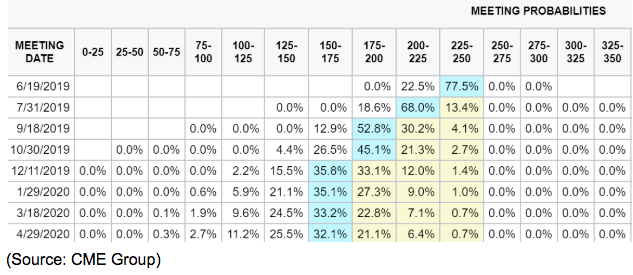
But while I think the bond market might be a bit overly optimistic about the probability of a July cut (87%) I do agree that we’re likely to get at least 1 cut relatively soon, and possibly two this year, IF the economic data indicates it’s necessary.
If it doesn’t then the bond and stock market is likely to be disappointed by the Fed not being as dovish as they wish. But if your main concern is we’re headed for a recession, then such a scenario wouldn’t necessarily be a bad thing.
Let’s not forget that rates near zero, due to a very weak economy (ie what Europe and Japan have) are NOT something to root for. Actual economic prosperity, which becomes more widely distributed and thus more robust over time (due to a tightening job market and faster wage growth) is far better for long-term stock returns than rates falling to zero and artificially boosting stock multiples.
Bottom Line: While Rising Recession Risks Mean it Might Make Sense to Buy Less Aggressively, it’s Not Yet Time to Batten Down The Hatches
Don’t get me wrong, I’m not totally ignoring the macroeconomic fundamentals and plan to gradually stop deploying my limited capital if a recession becomes extremely likely. My recession capital allocation plan is based on the five most commonly used recession confirmation signals that involve the yield-curve (the best recession forecaster yet discovered).
- 10 consecutive days of inversion (Bianco research model) – has occurred
- 1 consecutive month of inversion (David Rice model) – not yet occurred (June 23rd)
- 10 consecutive weeks of inversion of at least 15 basis points or more (Blackstone model)
- 3 consecutive months of inversion (Duke University model)
- 6 consecutive months of inversion (Morgan Stanley’s model)
As each of these confirmations occurs I pare back my monthly stock buying by 20% of my savings (right now I’m putting 80% of my savings into stocks, the rest into cash). Eventually, I’d be putting 100% of new money into cash, or in my case bond ETFs (Mint and VGLT), should the macroeconomic factors confirm that an economic downturn is a very high probability event.
But as scary as some of these economic reports (and model-based predictions) are right now, ultimately the aggregate data still supports the broader economist/analyst consensus that a recession is approximately a 40% probability event.
And since the primary cause of the slower growth we’re seeing today is the trade war, which can end relatively quickly, I am not personally willing to ignore all the great blue-chip bargains I see today (including quality companies trading at March 2009 valuations or better).
Of course, your financial situation and risk tolerance are almost certainly different than mine. However, as long as your long-term financial plan is based on the right asset allocation for your needs, and includes a diversified collection of quality dividend stocks, then the optimum strategy for today’s market isn’t actually that different from mine.
Specifically, that it’s not yet time to batten down the hatches (and definitely not time to abandon your long-term strategy) because a recession isn’t yet the most likely outcome of the next 12 to 18 months.
About the Author: Adam Galas

Adam has spent years as a writer for The Motley Fool, Simply Safe Dividends, Seeking Alpha, and Dividend Sensei. His goal is to help people learn how to harness the power of dividend growth investing. Learn more about Adam’s background, along with links to his most recent articles. More...
9 "Must Own" Growth Stocks For 2019
Get Free Updates
Join thousands of investors who get the latest news, insights and top rated picks from StockNews.com!
Top Stories on StockNews.com

Best & Worst Performing Mega Cap Stocks for July 23, 2025
BYDDF leads the way today as the best performing mega cap stock, closing up 5.83%.
Best & Worst Performing Mega Cap Stocks for July 22, 2025
HDB leads the way today as the best performing mega cap stock, closing up 4.22%.
Best & Worst Performing Mega Cap Stocks for July 21, 2025
IBKR leads the way today as the best performing mega cap stock, closing up 7.77%.
Best & Worst Performing Mega Cap Stocks for July 18, 2025
ABBNY leads the way today as the best performing mega cap stock, closing up 9.07%.