

The COVID-19 pandemic has significantly impacted Airbnb Inc. (ABNB - Get Rating), with noticeable drops in total listings and an estimated 72% decrease in bookings in 2020 compared to the previous year.
The company was compelled to streamline operations to reinforce its financial health amid the crisis, leading to a workforce reduction of approximately 25%. Additionally, Airbnb raised $2 billion through equity and debt to shore up its balance sheet during the pandemic.
Moreover, ABNB’s revenues per listing experienced a downward trend in the past year across the country. AllTheRooms, a short-term rental analytics firm, disclosed that Airbnb’s revenues per listing have dropped by nearly 50% in some cities.
Despite facing substantial challenges, ABNB began 2023 on steady footing amid the surge in travel, topping analysts’ estimates in the first quarter. However, it offered a cautious outlook for the second quarter because of the affordability pressure it is experiencing in North America.
The company warned that second-quarter comparisons would be tough, saying, “Nights and Experiences Booked will have unfavorable year-over-year comparisons in Q2 2023 as we overlap pent-up 2022 demand following the COVID Omicron variant.” Airbnb forecast second-quarter revenue between $2.35 billion and $2.45 billion.
With concerns over macroeconomic conditions and discretionary spending, ABNB’s short-term prospects look uncertain. The company also faces potential competition from budding alternatives in the rental landscape, which could impact its growth rate.
Thus, despite the resurgence in travel demand, it might not be the most opportune entry point in ABNB stock. By considering its key financial indicators, we can gain a more comprehensive understanding of the situation.
Analyzing ABNB’s Financial Performance: A Detailed Review of Net Income, Revenue, Margin, and Analyst Price Target
The trailing-12-month net income ABNB has displayed a clear growth trend through the recorded period. Notably, the fluctuations can roughly be categorized into four distinct phases:
- Phase 1 “Negativity and Struggle” (December 2020 – September 2021): During this phase, ABNB was reporting negative net income, suggesting a financial struggle. The net income ranged from -$4.58 billion in December 2020 to -$4.29 billion in September 2021.
- Phase 2 “Comeback” (December 2021): By the end of this period, ABNB significantly minimized its losses to -$352 million.
- Phase 3 “Turning Profit” (March 2022 – September 2022): This phase marked the point at which ABNB began to make profits again. The net income rose substantially from $801 million in March 2022 to $1.62 billion in September 2022.
- Phase 4 “Sustained Growth” (December 2022 – March 2023): During this phase, ABNB not only sustained profits but also showed noteworthy growth. The net income grew from $1.89 billion in December 2022 to a robust $2.02 billion by March 2023. Calculating the growth rate from December 2020 to March 2023, it can be interpreted that the company moved from -$4.58 billion to $2.02 billion providing a significant positive swing.

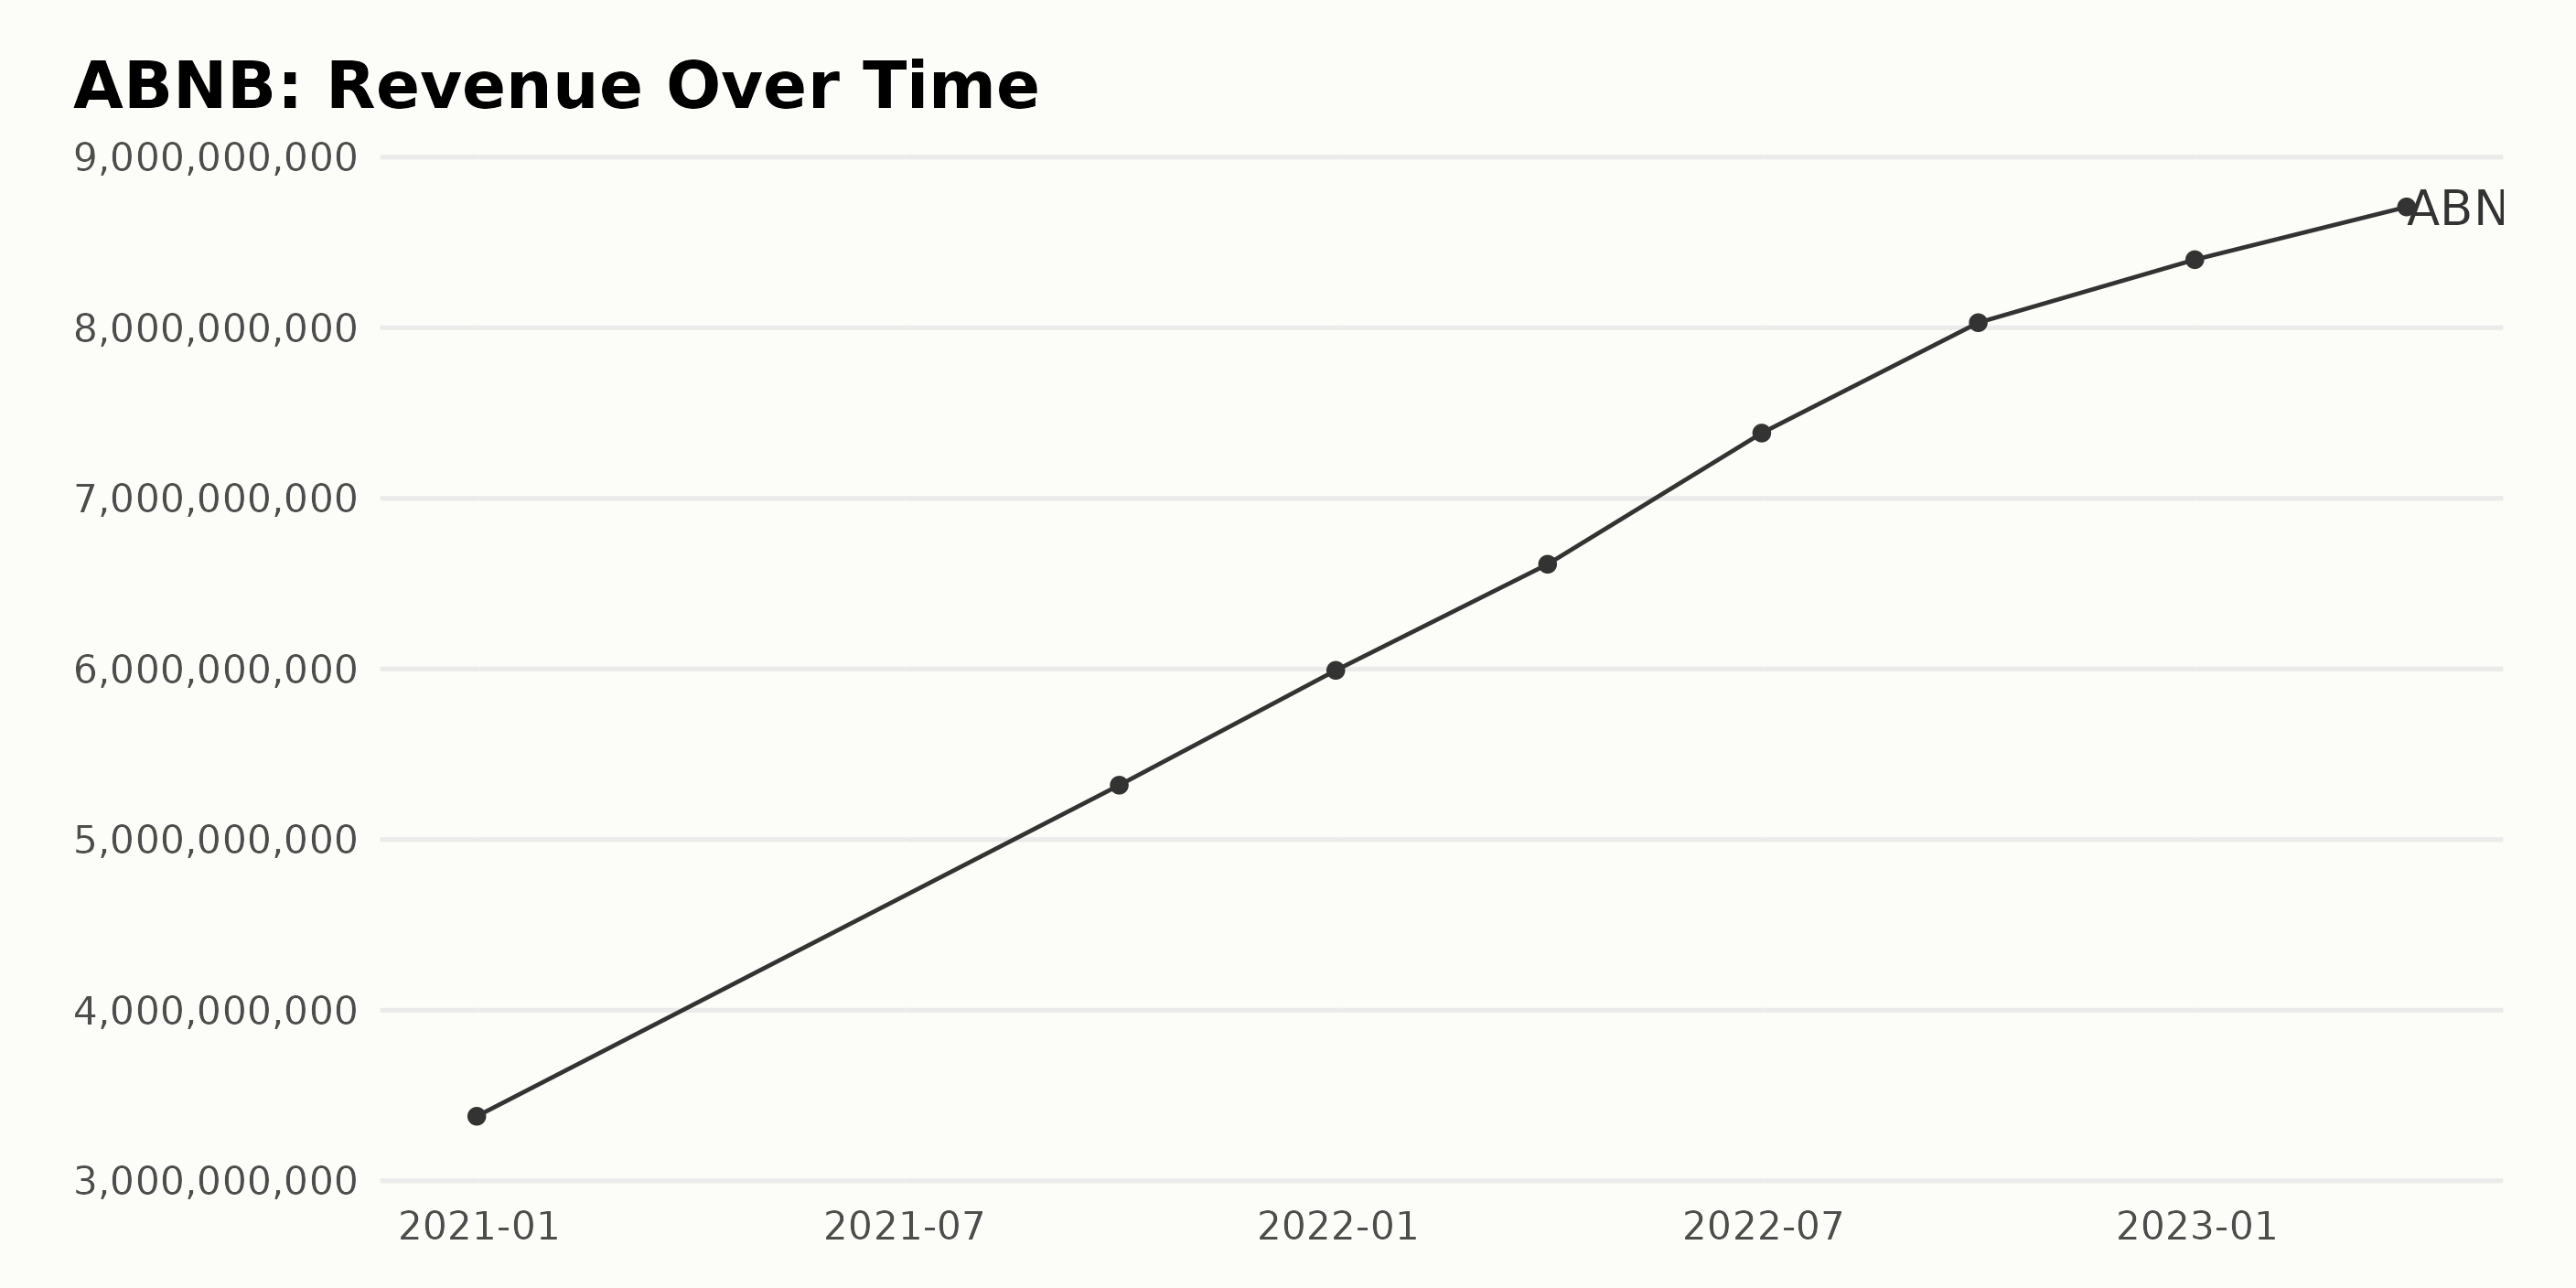
The trend of its trailing-12-month revenue showed consistent growth between December 2020 and March 2023. Here are the significant observations:
- At the beginning of the series on December 31, 2020, the revenue stood at $3.38 billion.
- As of September 30, 2021, the revenue increased to $5.32 billion, followed by another rise to $5.99 billion by December 31, 2021.
- Over the following year, in 2022, there was a noticeable continuous increase in revenue. For the first quarter ending on March 31, it reached $6.61 billion. Mid-year data from June 2022 showed it at $7.38 billion, and by the end of the third quarter (September 30), it rose further to reach $8.03 billion.
- The annual figures for December 2022 showed revenue at $8.39 billion.
- The most recent figure available, for the first quarter of 2023, ending March 31, reported revenue at approximately $8.71 billion.
Overall, there has been a considerable upward trajectory in ABNB’s revenues, with relatively minor fluctuations indicating a solid growth pattern. By comparing the first recorded value to the latest, it’s clear that from December 2020 to March 2023, revenue grew by approximately $5.33 billion, or about 157%.
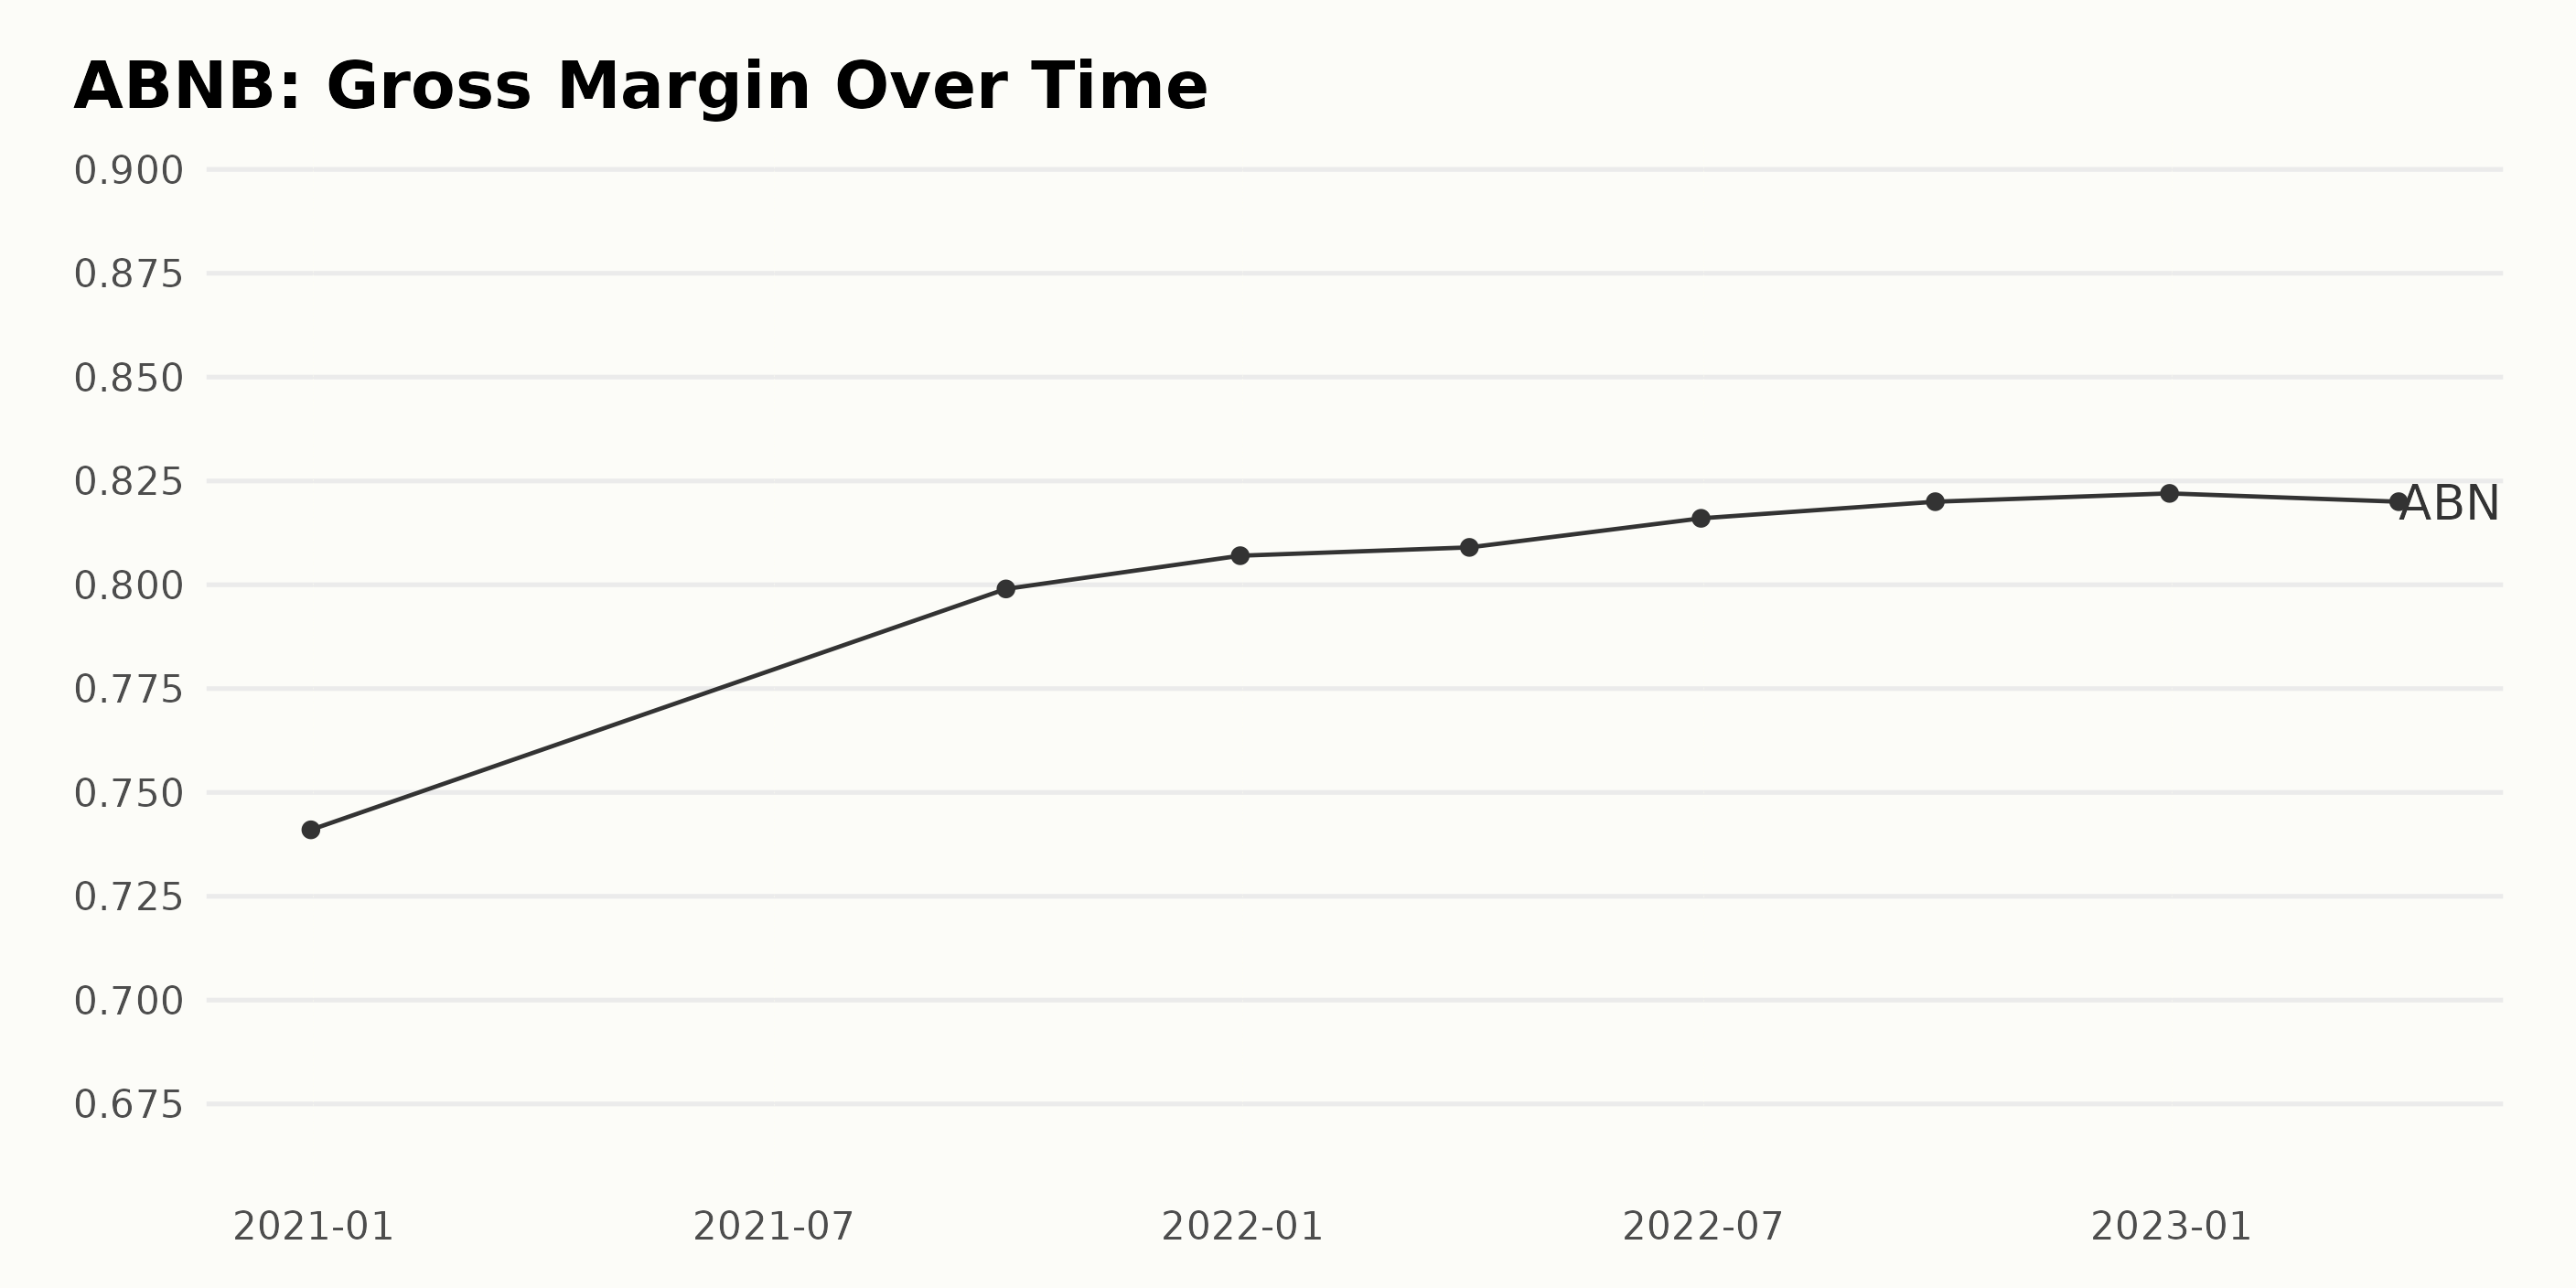
The gross margin of ABNB showed an overall upward trend from December 2020 to December 2022, with occasional minor fluctuations.
- On December 31, 2020, the gross margin was 74.1%.
- On September 30, 2021, it increased to 79.9%.
- By the end of 2021 (December 31), it had reached 80.7%.
- It was slightly higher at 80.9% on March 31, 2022.
- The growth continued in June 2022, climbing up to 81.6%.
- As of September 30, 2022, it rose slightly to 82.0%.
- The gross margin peaked at 82.2% on December 31, 2022.
- A slight decrease was observed in the first quarter of 2023, dropping to 82.0% on March 31.
From the first recorded value (74.1%, December 2020) to the last (82.0%, March 2023), a growth rate of approximately 10.7% was observed.
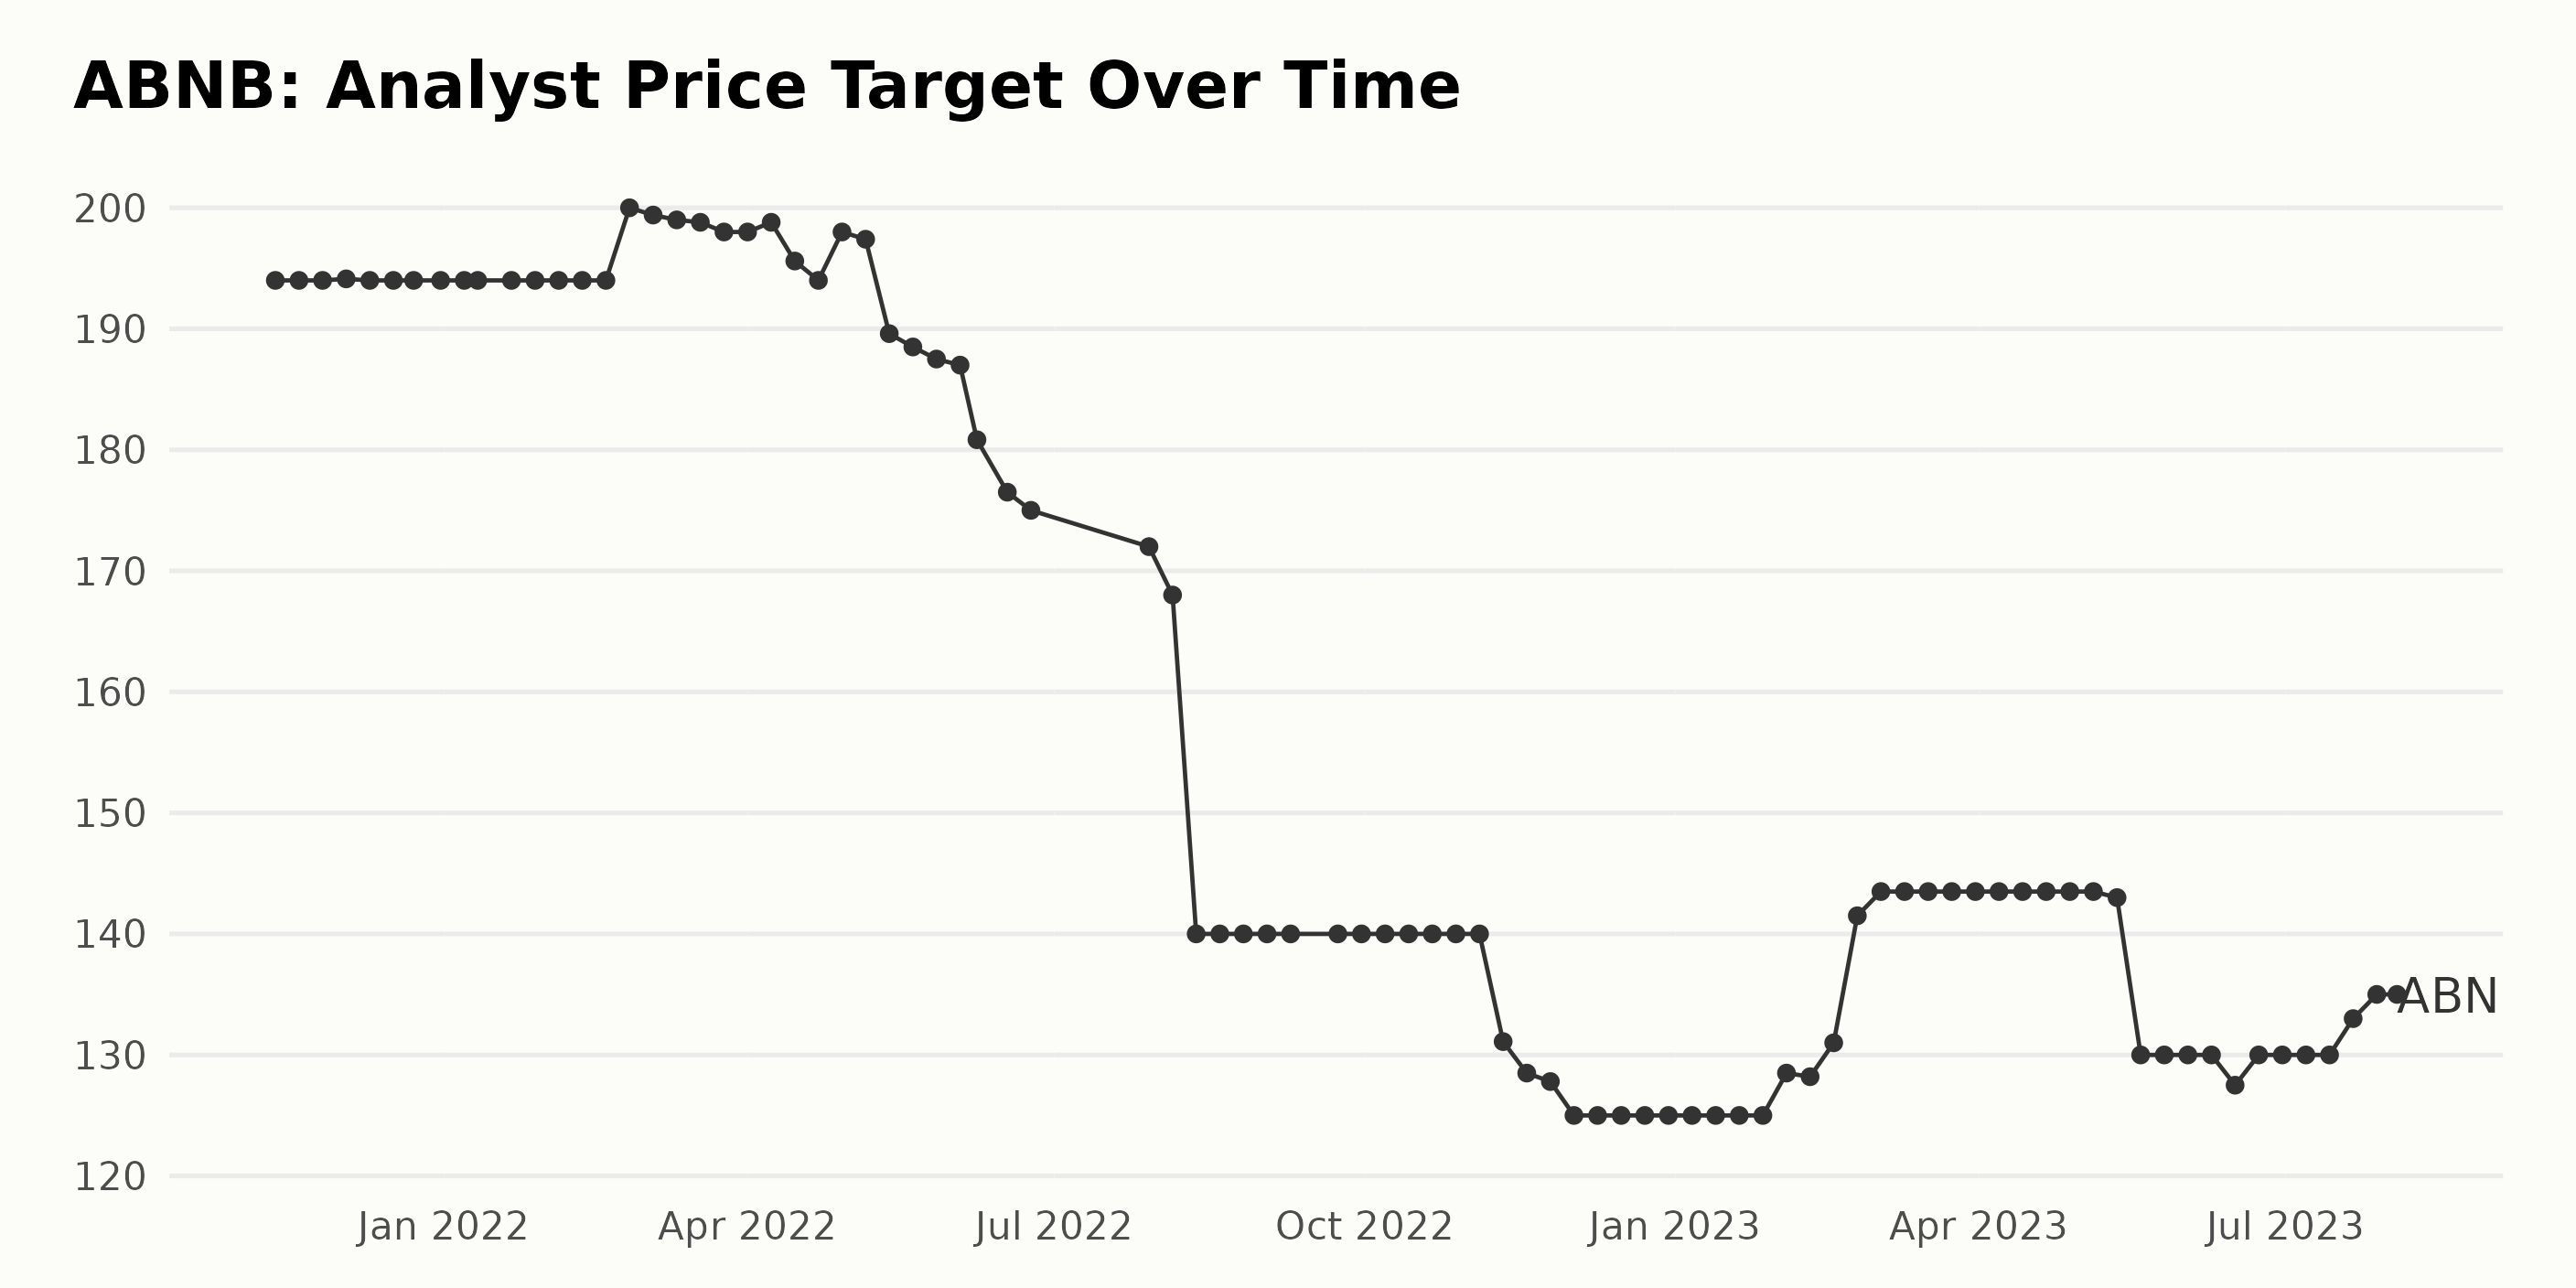
Based on the provided data, the Analyst Price Target (APT) for ABNB has shown fluctuations between November 2021 and August 2023. A summary of the trend and fluctuations is as follows: –
- The APT of ABNB started at $194 in November 2021 and remained relatively consistent until February 2022, when it saw a swift rise to $200.
- From March through May 2022, there was a noticeable decline in the APT from $199.4 to $187. By June 2022, the APT fell sharply to $175.
- A drastic decrease was observed in August 2022, when the APT dropped to $140, where it largely remained until the end of 2022, with minor declines to a low of $125 in December.
- In early 2023, the APT remained at $125 until February 2023, when there was a quick spike to $141.5 by the end of the month.
- However, this increase did not last long, with the APT falling back to $130 by May 2023 before gradually increasing to $135 by August 2023.
This gives a growth rate of -30.44%, indicating a decline overall. It is important to note that despite these fluctuations, the changes have been relatively small on a week-to-week basis but show a clear overall declining trend. As the latest data point suggests a slight upturn, it will be intriguing to observe if this indicates any shift toward a recovery in the upcoming months.
Analyzing ABNB Share Trends in 2023: From bearish downturns to bullish highs
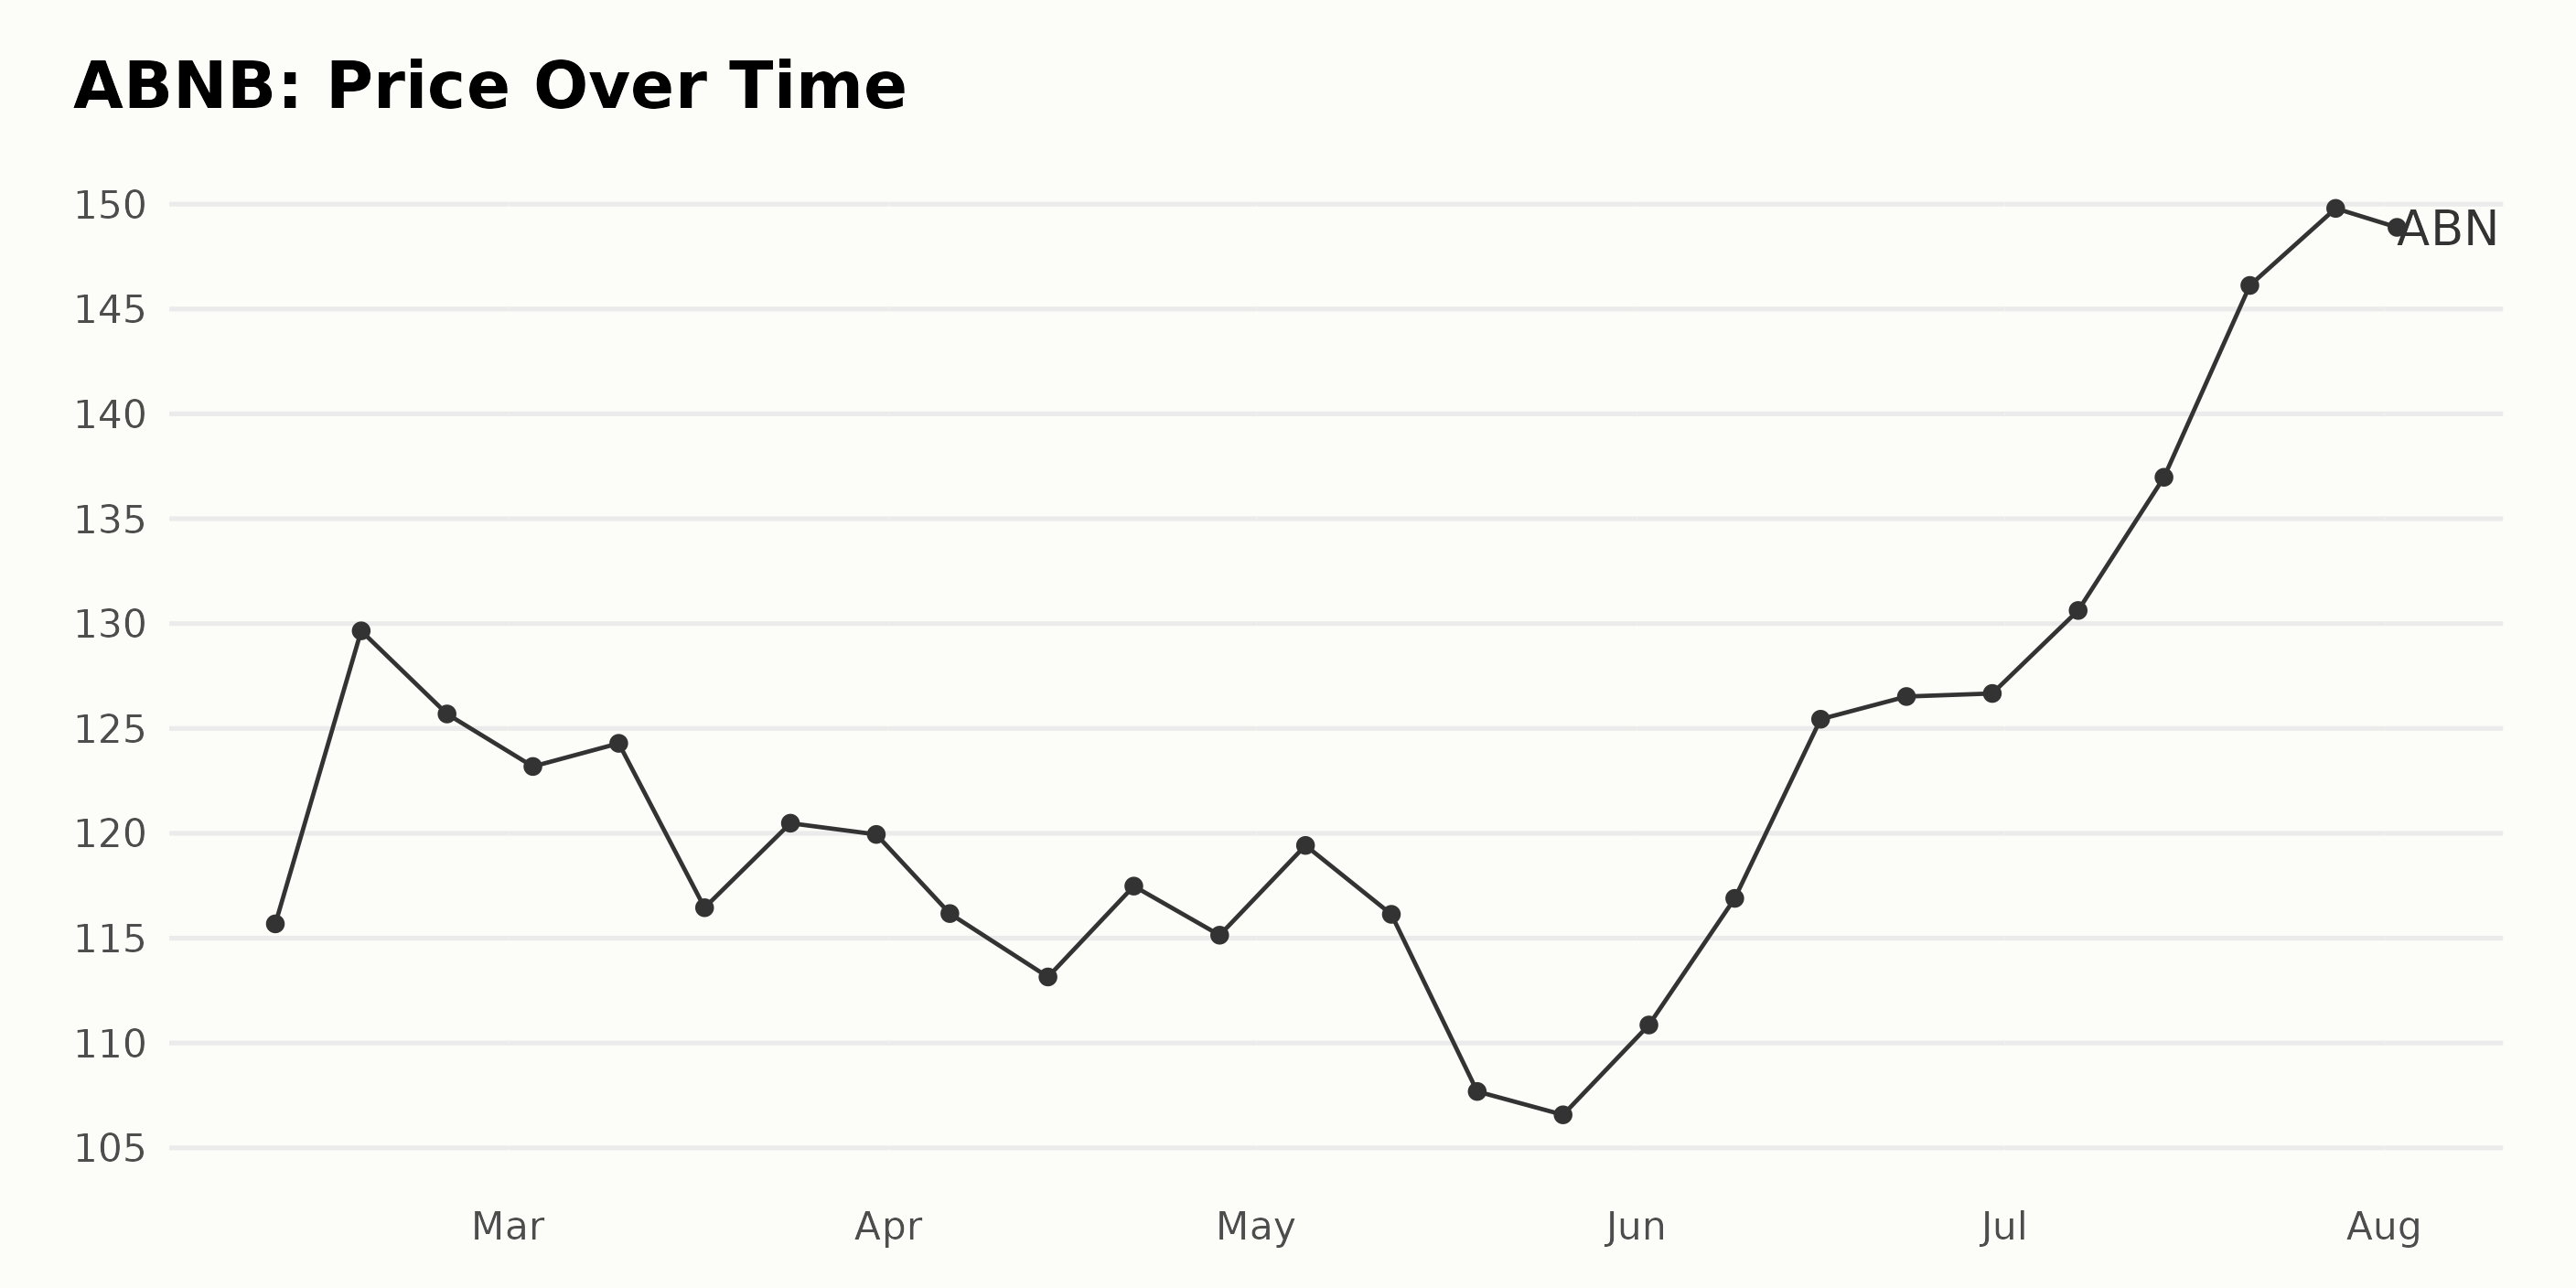
The ABNB share data provided reveals a number of trends:
- February 10, 2023: The share price started at $115.68.
- Mid-February 2023: There was a surge, with prices reaching $129.65 on February 17 before returning to $123.18 by March 3 and increasing modestly to $124.29 by March 10.
- Late March to April 2023: Prices steadily declined from $124.29 on March 10 to a low point of $113.15 on April 14, an overall reduction of around 9%.
- April to May 2023: Prices rebounded back and forth, peaking at $119.42 on May 5 but finally dropping to a new low of $106.57 by the end of May.
- June to July 2023: The next two months marked a strong recovery. Prices climbed consistently, reaching a high of $130.62 by July 7. The growth rate seems to be accelerating during this period.
- Mid to Late July 2023: This upward trend continued and even accelerated, with prices hitting $149.80, a significant increase, by the end of July.
- Early August 2023: There was a slight dip in the price to $148.91 on August 2.
Overall, the ABNB shares exhibited an initial growth phase in mid-February, followed by a bearish trend swing until the end of May. From June onwards, there was a clear bullish trend, with prices peaking at the end of July, with some leveling off observed at the beginning of August. Here is a chart of ABNB’s price over the past 180 days.
Analyzing ABNB’s POWR Ratings
ABNB has an overall C rating, translating to a Neutral in our POWR Ratings system. It also has a C grade in Growth and Sentiment. ABNB is ranked #15 out of the 22 stocks in the Travel – Hotels/Resorts category.
Here are some more details regarding its rank within the category over this time period:
- February 2023: The rank in the category was stable at 15 for the first half, improving to 13 by the end of the month.
- March 2023: There was a steady improvement, starting the month with a rank of 13 and ending with a rank of 11.
- April 2023: The rank fluctuated throughout the month, peaking at 15 and closing at ten by the end of April.
- May 2023: The rank reached its best at nine at the start but deteriorated to 14 by the end of the month.
- June 2023: The rank fluctuates between 14 and 17 throughout June.
- July 2023: It slightly improved to 14 initially and then remained steady.
- On August 2, 2023, the rank was recorded at 15.
As lower values denote a superior rank, it is observed that the best rank in the category achieved by ABNB during this period was 9 (on May 6, 2023), while the worst was 17 (on June 17, 2023). It’s important to note that ABNB is compared against 22 stocks in the Travel – Hotels/Resorts category. Overall, the ranking of ABNB within the Travel – Hotels/Resorts category fluctuated but generally stayed in the middle of the pack.

Stocks to Consider Instead of Airbnb Inc. (ABNB)
Other stocks in the Travel – Hotels/Resorts sector that may be worth considering are Genting Berhad (GEBHY - Get Rating), Bluegreen Vacations Holding Corp. (BVH - Get Rating), and Playa Hotels & Resorts N.V. (PLYA - Get Rating) — they have better POWR Ratings.
What To Do Next?
Discover 10 widely held stocks that our proprietary model shows have tremendous downside potential. Please make sure none of these “death trap” stocks are lurking in your portfolio:
Want More Great Investing Ideas?
ABNB shares were trading at $140.96 per share on Thursday afternoon, down $3.60 (-2.49%). Year-to-date, ABNB has gained 64.87%, versus a 18.49% rise in the benchmark S&P 500 index during the same period.
About the Author: Subhasree Kar

Subhasree’s keen interest in financial instruments led her to pursue a career as an investment analyst. After earning a Master’s degree in Economics, she gained knowledge of equity research and portfolio management at Finlatics. More...
More Resources for the Stocks in this Article
| Ticker | POWR Rating | Industry Rank | Rank in Industry |
| ABNB | Get Rating | Get Rating | Get Rating |
| GEBHY | Get Rating | Get Rating | Get Rating |
| BVH | Get Rating | Get Rating | Get Rating |
| PLYA | Get Rating | Get Rating | Get Rating |


