
Sir Jim Ratcliffe, the CEO of INEOS, has put forth a proposition to acquire a minority stake in Manchester United plc (MANU), a premier Manchester-based European football team. However, this proposal, which would enable Ratcliffe to obtain a 25% stake and co-own the club alongside the Glazer family, doesn’t appear to have enthused MANU’s investors.
MANU’s investors are seemingly unimpressed by this proposal of a 25% stake acquisition to join the Glazer family in co-ownership of the Manchester United club. Alternative media reports indicate that Qatari businessman Sheikh Jassim bin Jaber Al Thani’s £5 billion ($6.07 billion) takeover offer remains the ‘highest’ offer made to the Glazers.
This shift in potential ownership has sent MANU’s stocks into a turbulent state, with the stock showing a declining trend. The stock closed the last trading session at $19.41, falling short of its 50-day moving average of $21.35 and its 200-day moving average of $21.75.
Given this current state of affairs, it’s necessary to scrutinize the trends within MANU’s prime financial metrics. Based on these factors, it seems advisable for potential investors to steer clear of the stock for now.
Manchester United Financial Performance Overview: 2020-2023
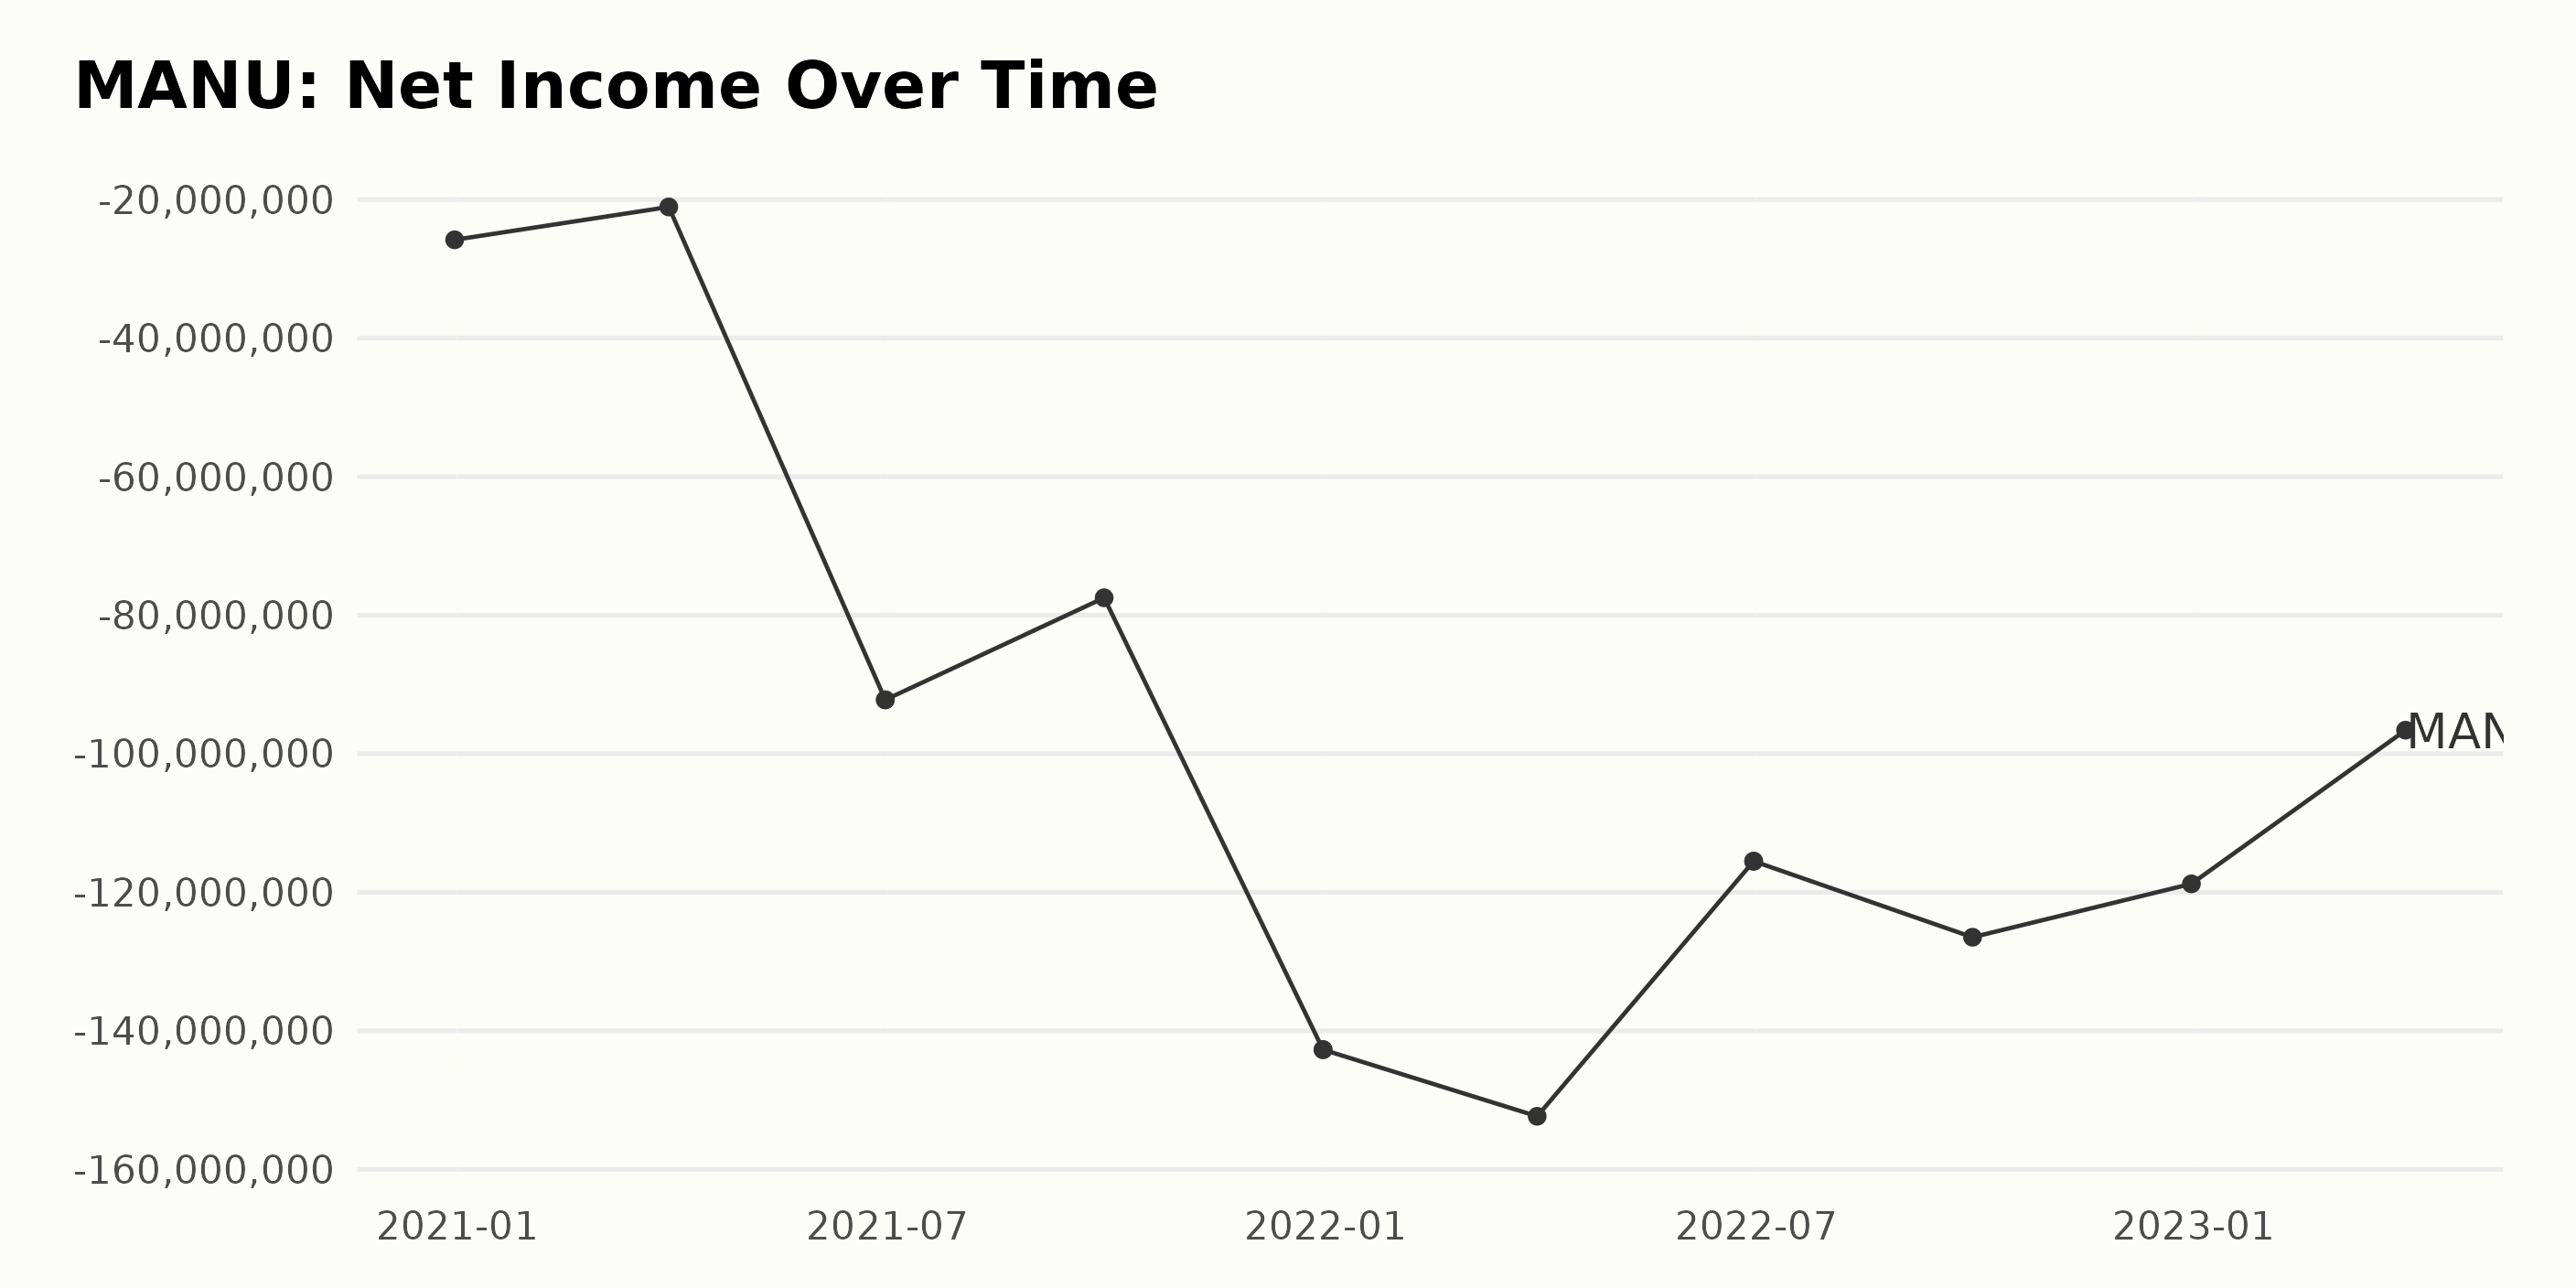
The review of the trailing-12-month net income data for MANU reveals a downward trend over the period from December 2020 to March 2023.
- At the start of the series on December 31, 2020, net income stood at -$25.81 million.
- Through March 2021, the loss narrowed slightly to -$21.07 million.
- However, June 2021 saw a significant drop in net income with a reported loss of -$92.22 million, which remained stable through the end of the quarter.
- Throughout the rest of 2021 and into 2022, net income fluctuated with a general downward trend. The losses peaked at -$152.33 million in March 2022 before decreasing to -$115.51 million in June 2022 (reported twice).
- The final part of 2022 saw a further decrease to -$126.49 million in September, with a marginal improvement to -$118.78 million by the end of December.
- As of the most recent data point on March 31, 2023, net income reported a loss of -$96.60 million.
In summary, while there have been fluctuations throughout the period, the overall trend has been negative, with the net income of MANU increasing its losses from -$25.81 million in December 2020 to -$96.60 million in March 2023. This represents a considerable decrease in net income for MANU over this period.
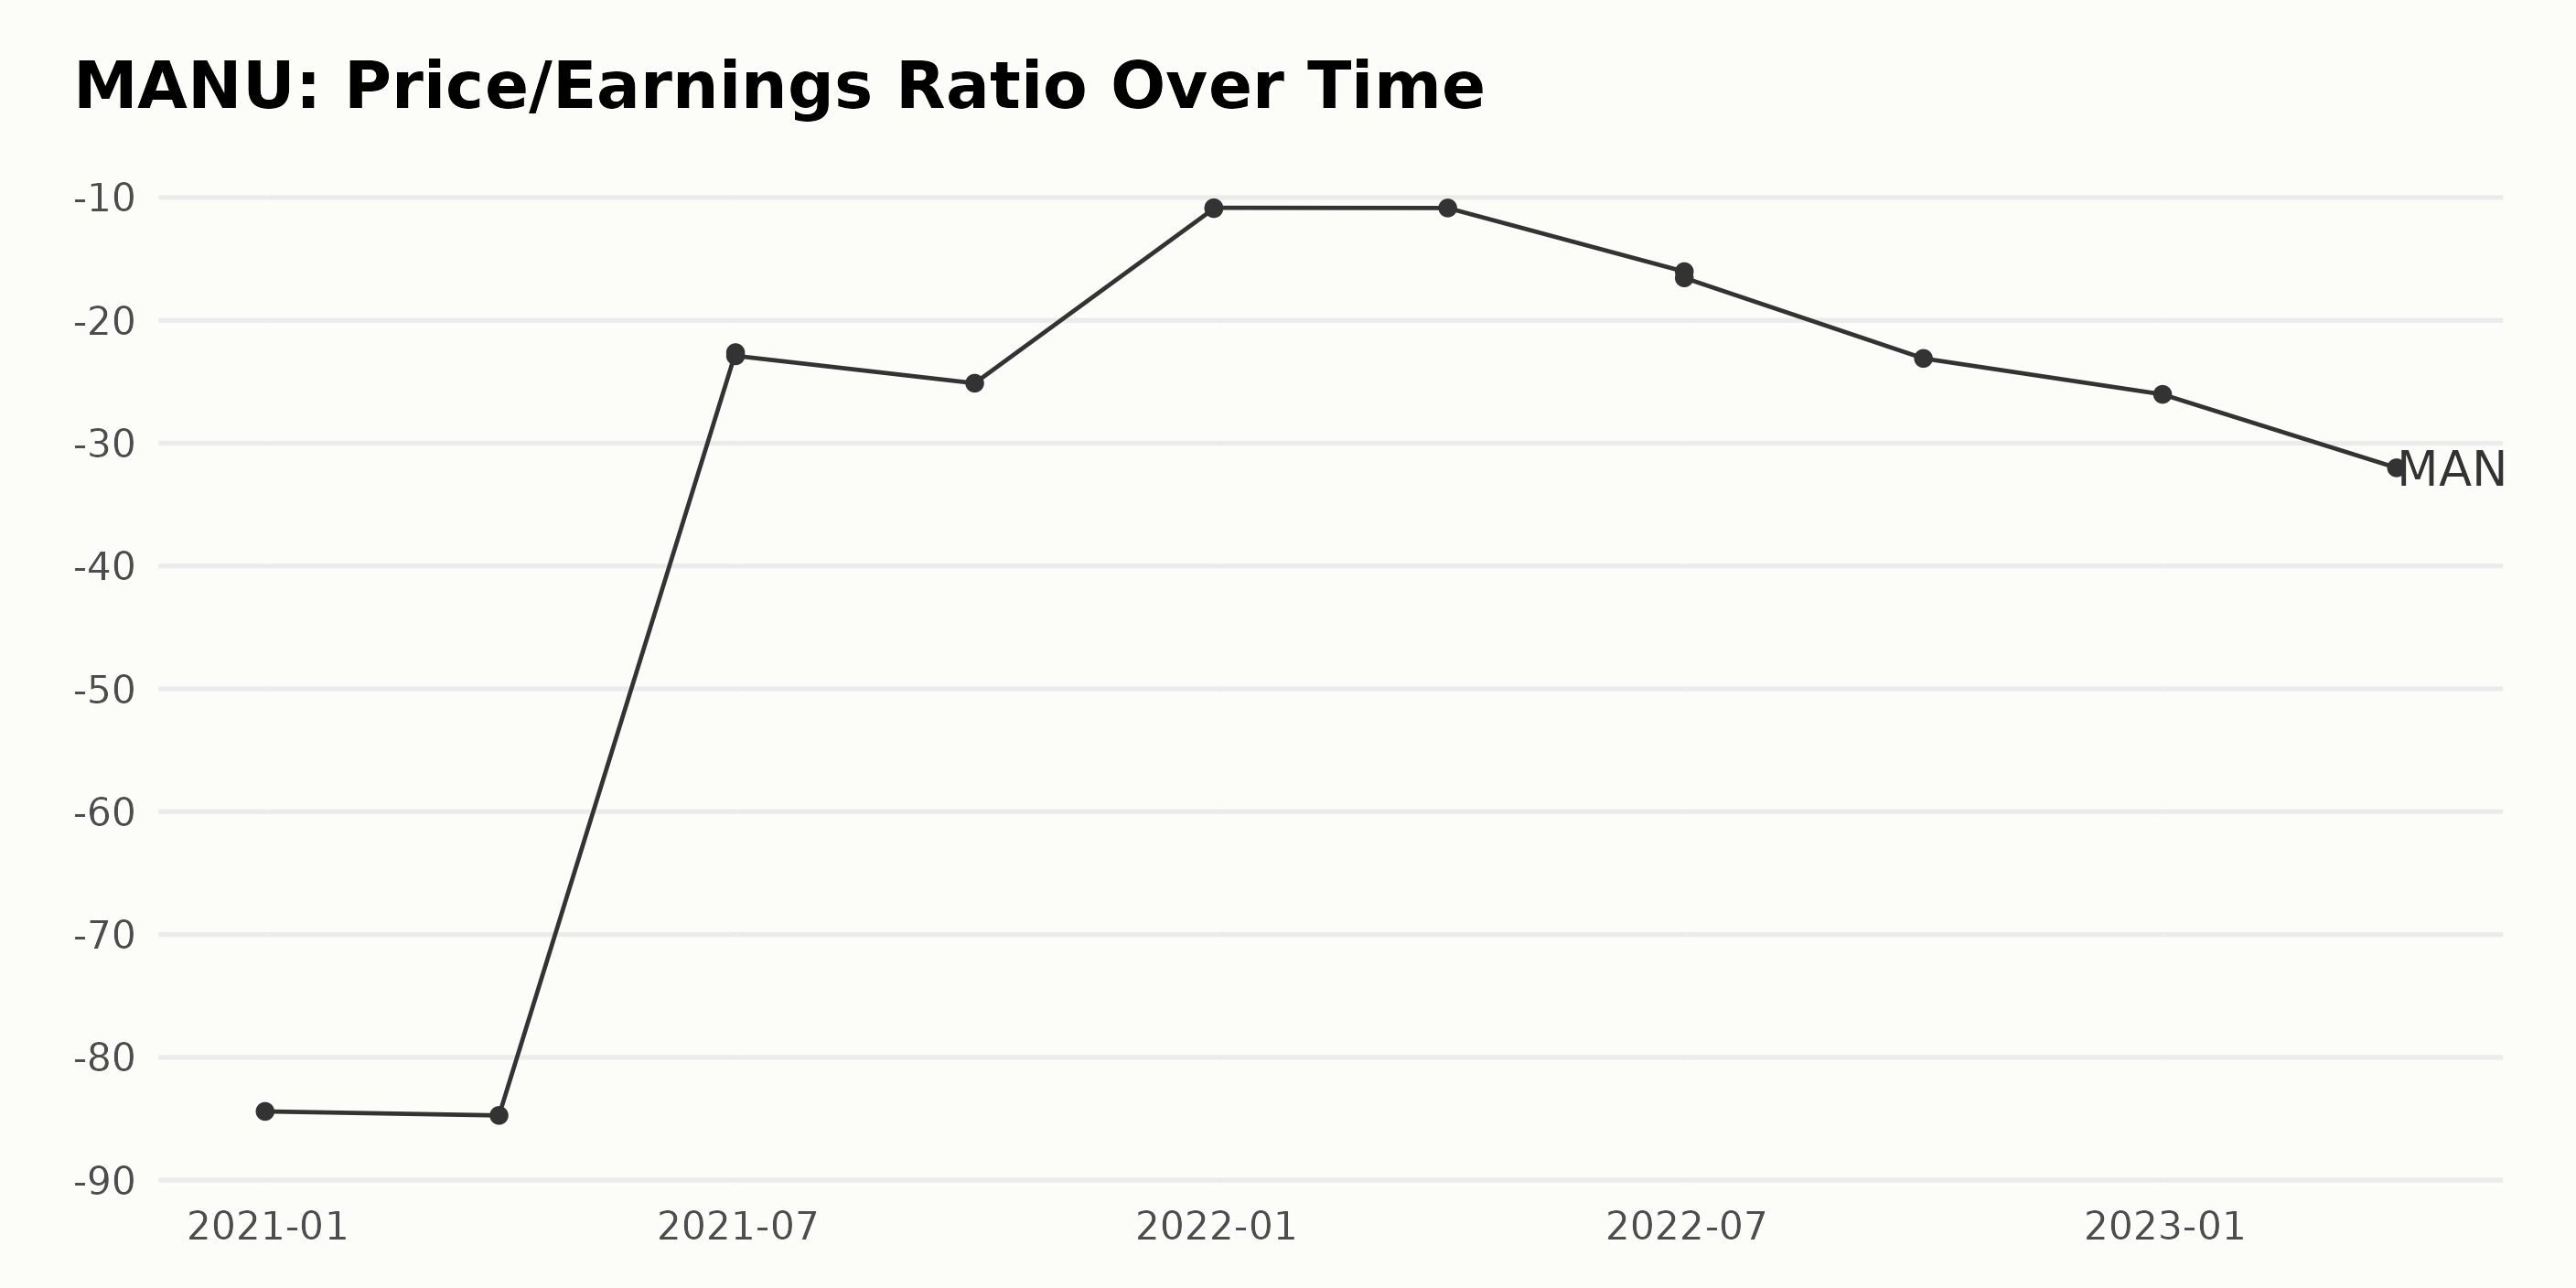
The series of data for the Price/Earnings ratio (P/E) for MANU over the given period shows variable figures with notable fluctuations. Highlights:
- The P/E started at a value of -84.4 in December 2020 and fluctuated negatively throughout the time frame.
- The lowest P/E in the first quarter was in March 2021, with -84.73, but by June 2021, there had been a significant rise to -22.89.
- A continued increase would have likely indicated a positive growth rate, but instead, there was a drop in September 2021, where the figure went down further to -25.12.
- There was a significant improvement towards the end of 2021; the P/E rose to -10.9 by December. However, this progress was then overshadowed by consistent drops over the next year.
- By December 2022, the P/E had dropped again to -26.03 and continued downward into March 2023, ending at -32.01.
Looking at these values, the overall growth rate for the period is negative. Taking into calculation from the starting value in December 2020 to the last in March 2023, the decline is approximately 62%. This suggests the company experienced notable turbulence in the Price/Earnings ratio during this period.
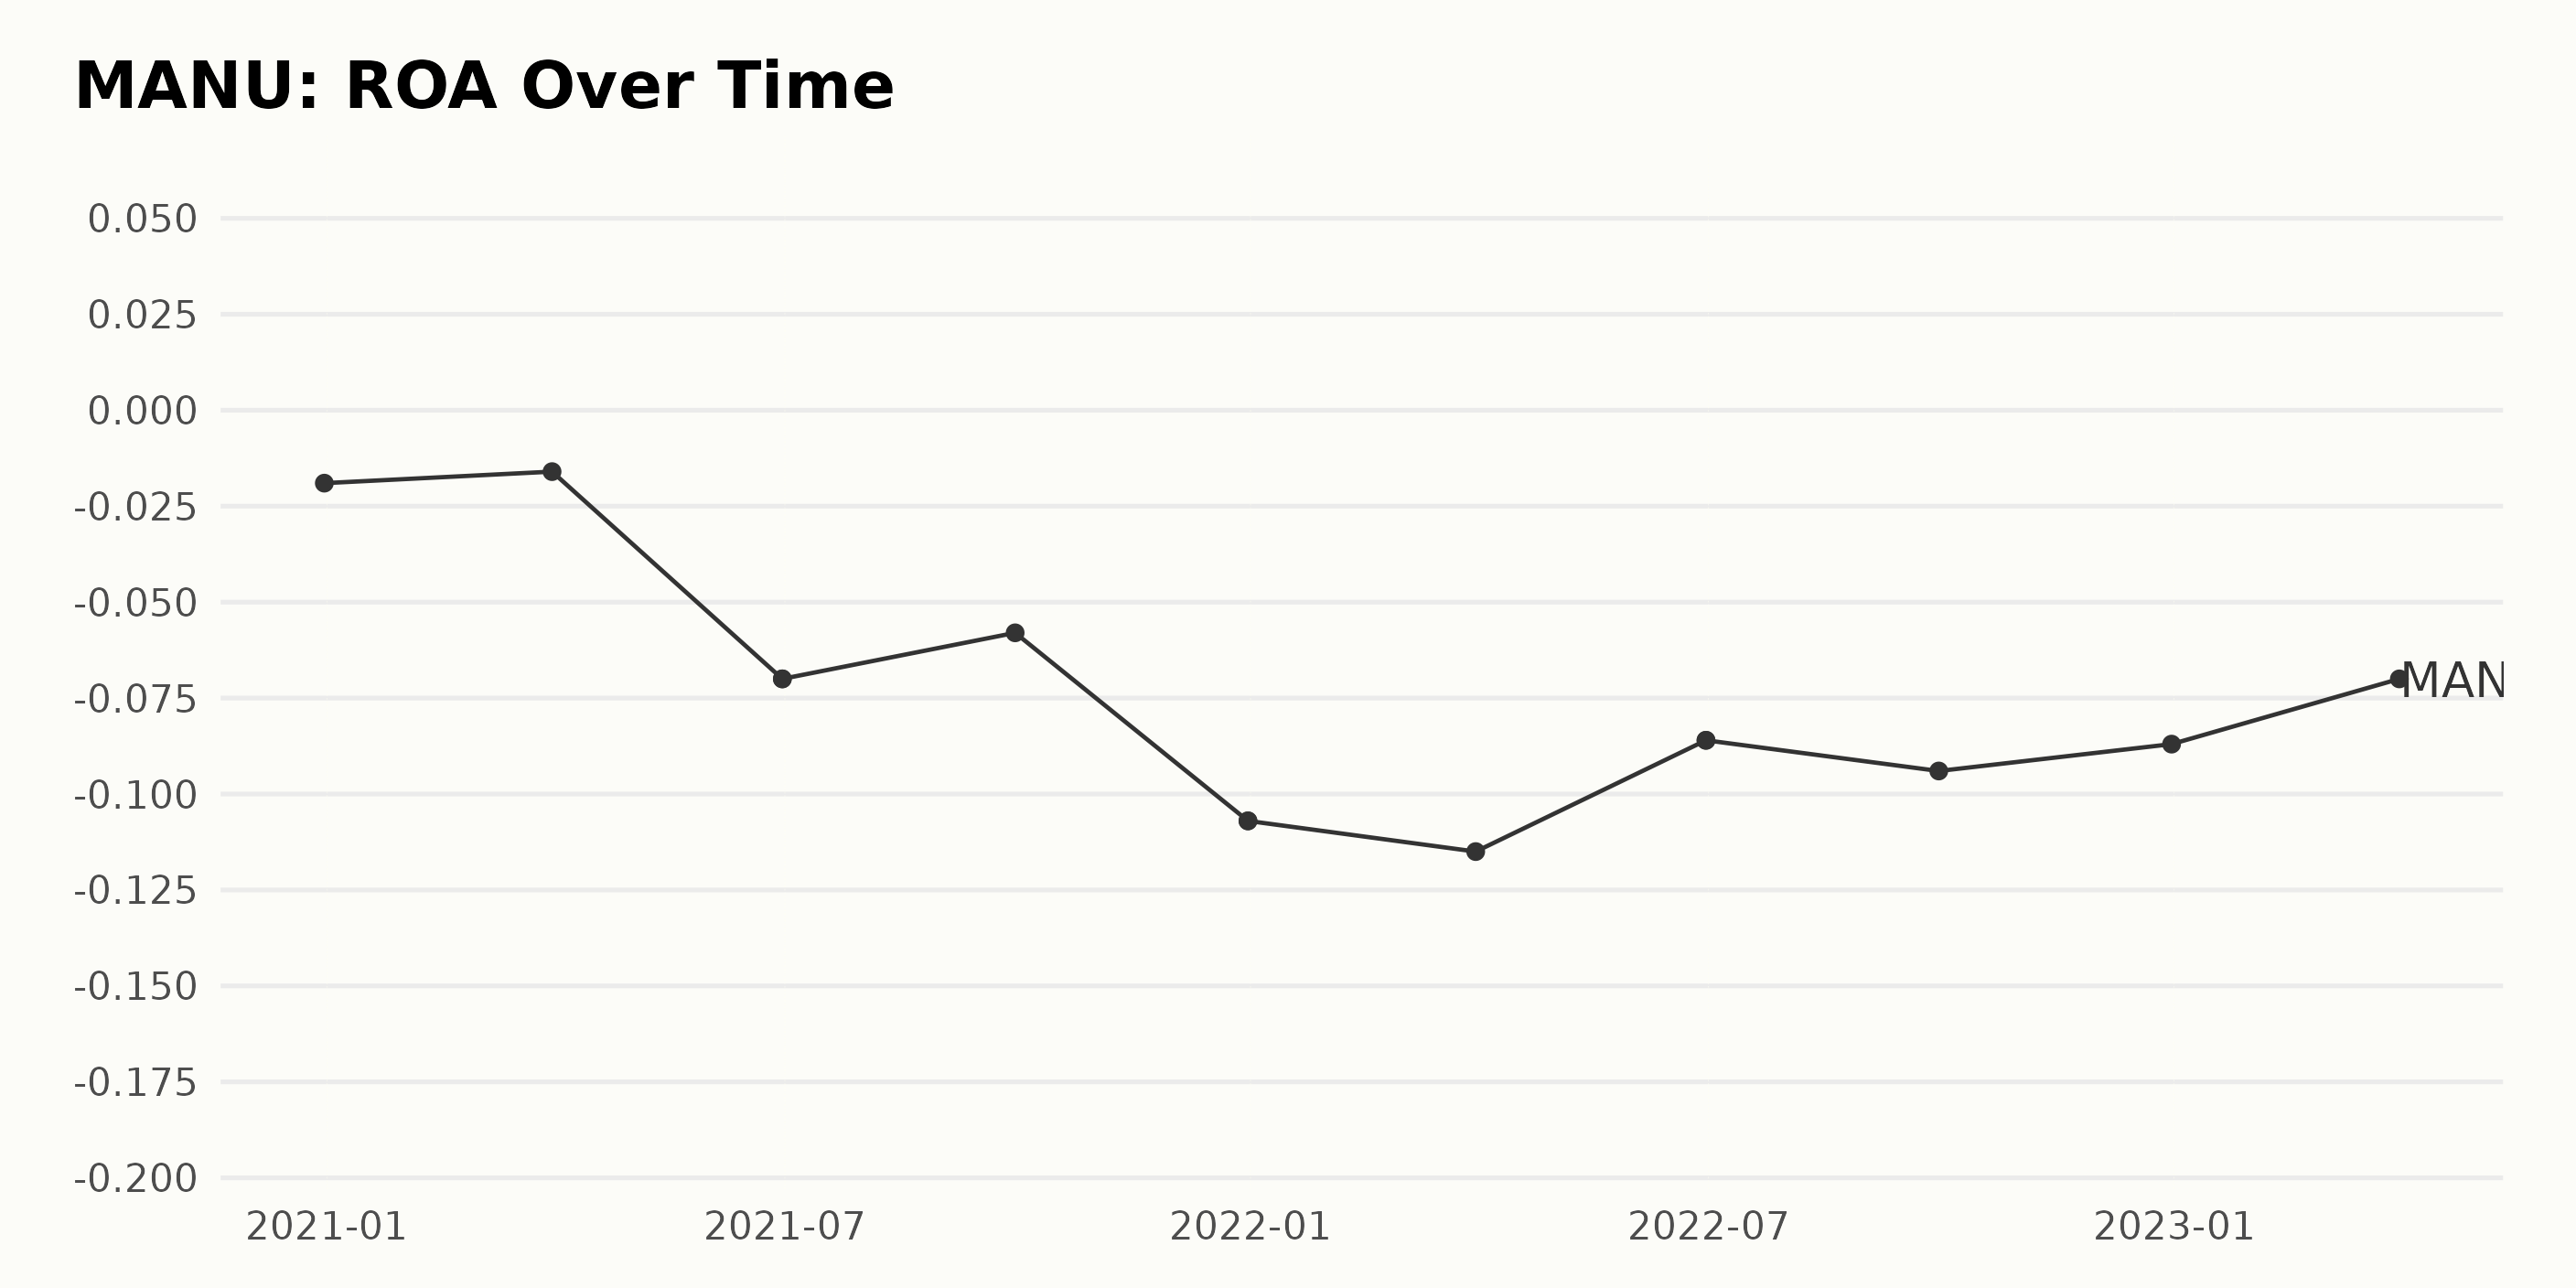
The reported Return On Assets (ROA) for MANU has showcased a general downward trend, with several fluctuations, over the time series starting from December 31, 2020, to March 31, 2023. Key points:
- On December 31, 2020, the ROA was -1.9%.
- There was a mild recovery by March 31, 2021, when the ROA increased to -1.6%.
- A sharp decline occurred by June 30, 2021, to -7.0%, and maintained this value in repeated measures.
- This was followed by a recovery, albeit slight, by September 30, 2021, to -5.8%.
- A significant drop again by December 31, 2021, to -10.7%, repeating this value in the next measure.
- In the months of 2022, the ROA seesawed between -11.5% (March 31, 2022) down to -8.6% (June 30, 2022) and then back up to -9.4% (September 30, 2022).
- The year ended on a slightly positive note, with ROA at -8.7% (December 31, 2022).
- The final reported value on March 31, 2023, showed an improvement to -7.0%.
From these data points, one can observe a more significant emphasis on the recent trends, particularly in the years 2022 and 2023. Although there were fluctuations throughout, the overall direction was falling.
Comparing the first and last data point (-1.9% in December 2020 vs. -7.0% in March 2023), the ROA fell by approximately 5.1 percentage points over this timespan, marking a negative growth in asset returns for MANU.
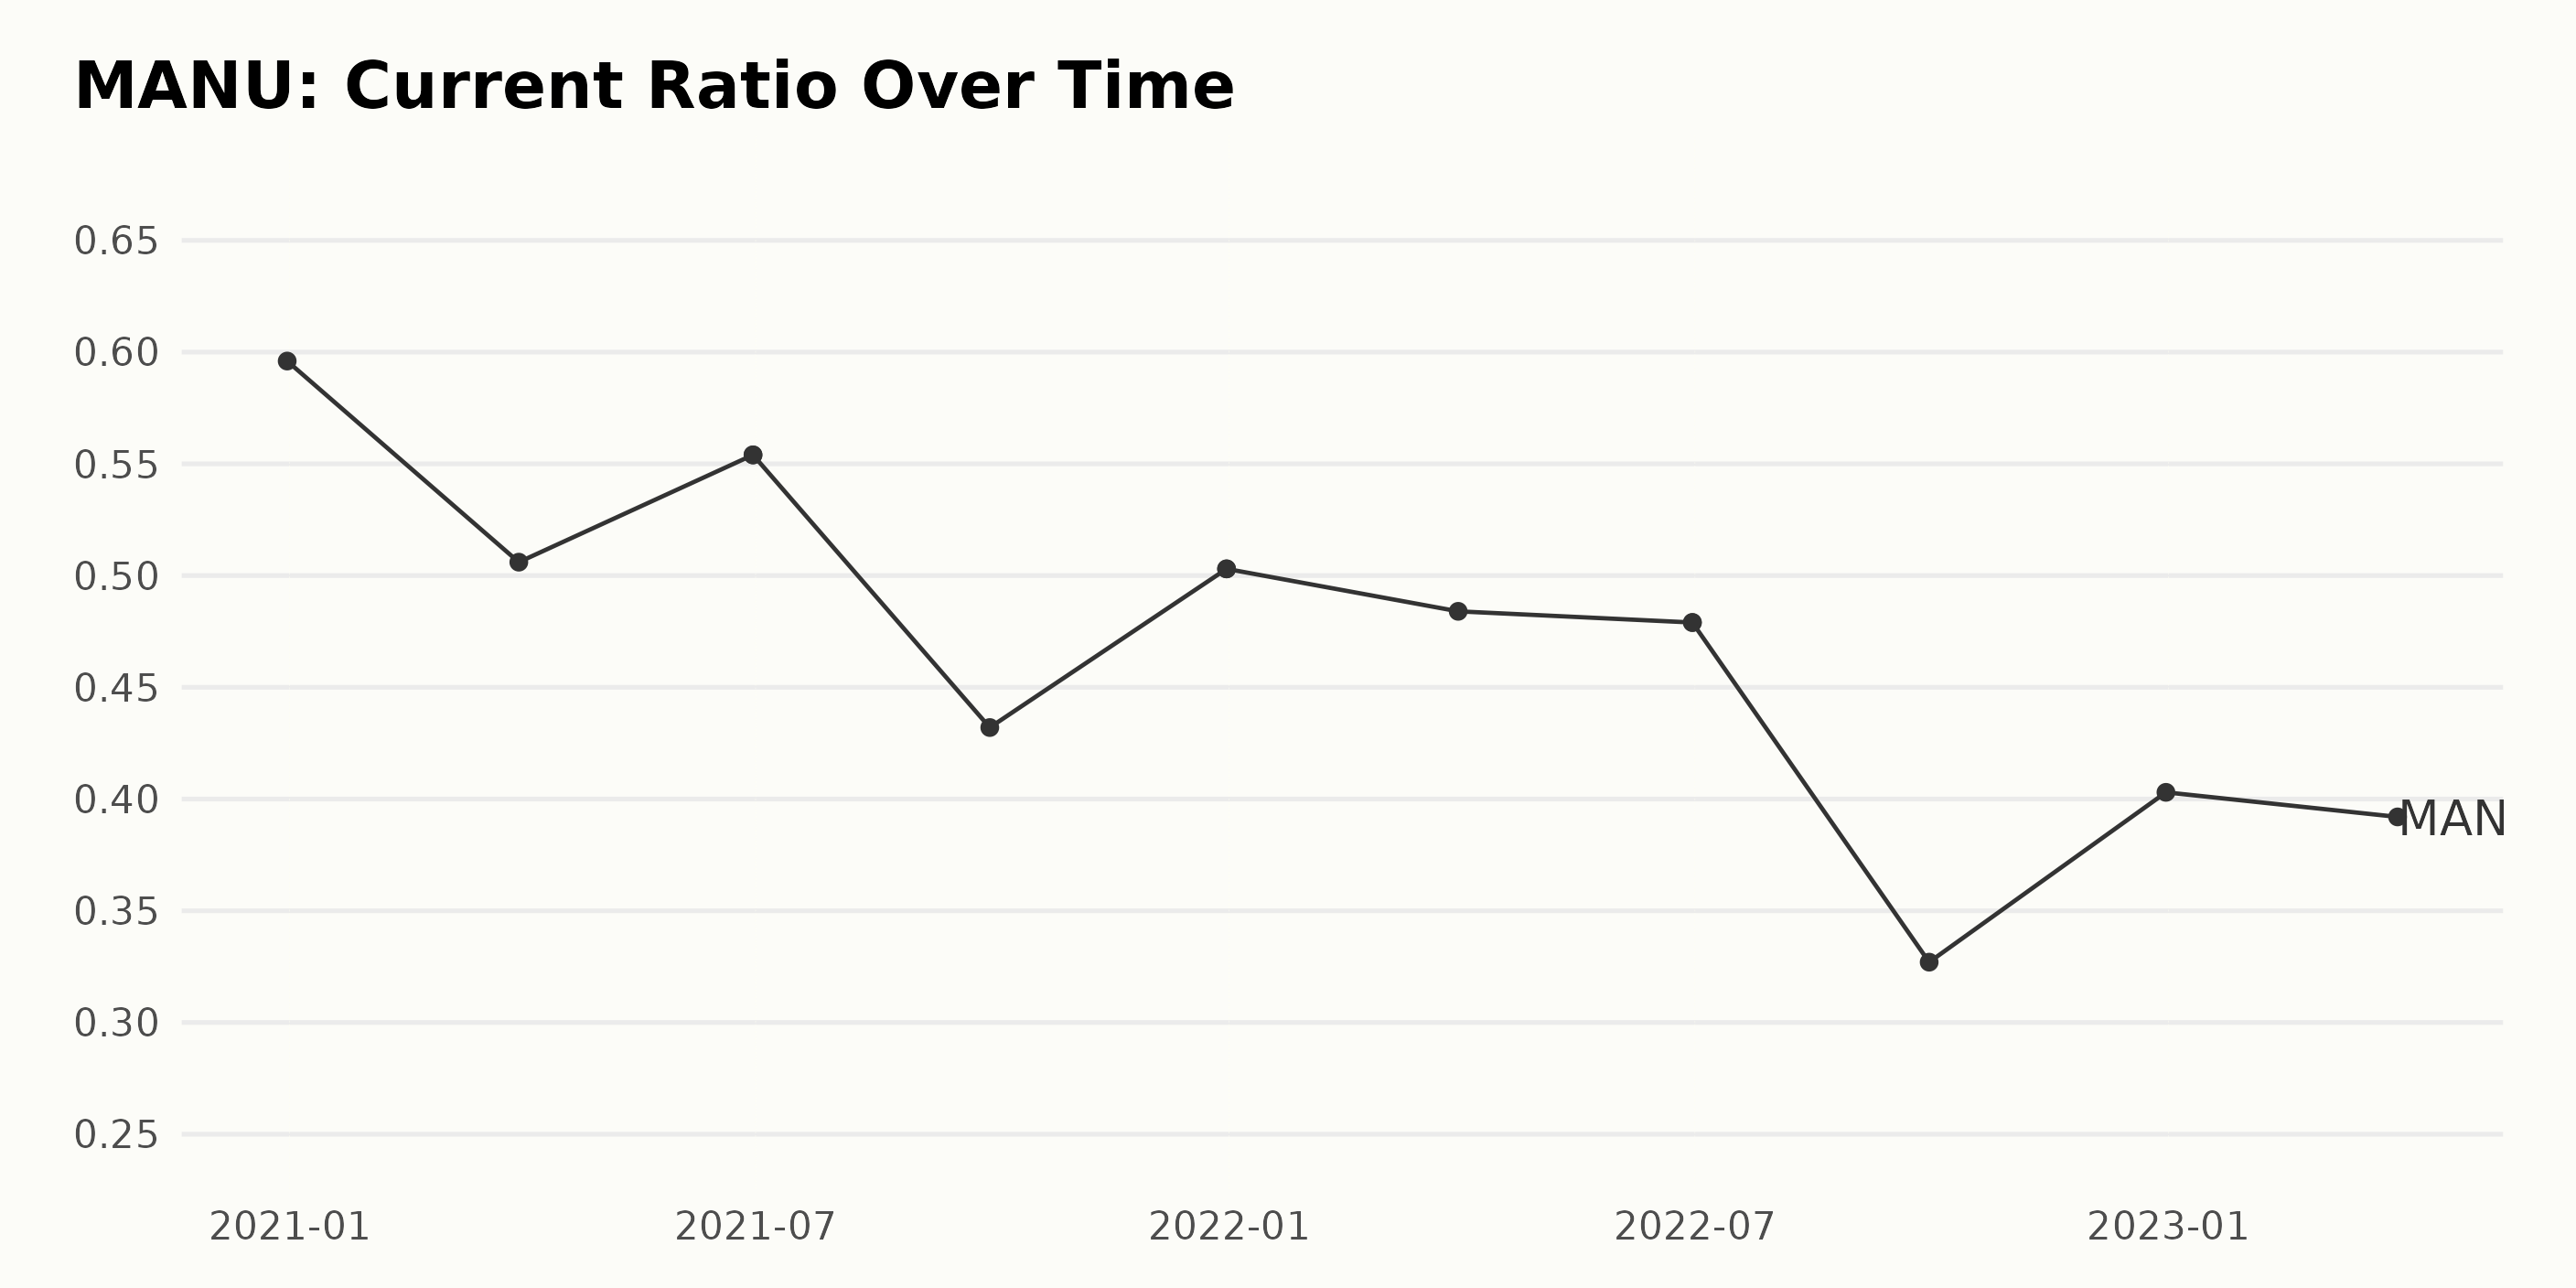
The data shows that the current ratio of MANU has experienced notable fluctuations over the given timeline spanning from December 2020 to March 2023. Here’s a snapshot of the key trends observed:
- Starting with a reading of 0.60 in December 2020, the current ratio faced a downward trajectory, falling to 0.51 by March 2021.
- In subsequent months, notably between March and June 2021, there was a slight resurgence, bringing the current ratio back up to 0.55, only to fall again, reaching 0.43 by September 2021.
- A similar rise and fall pattern occurred, as the current ratio climbed back up to 0.50 by December 2021, then dropped slightly to reach a value of 0.48 by June 2022.
- September 2022 saw a drop in the current ratio to 0.33, the lowest point in the entire data series.
- Since that low point, the current ratio recovered, reaching 0.40 by December 2022, and maintained an almost steady value of around 0.39 as of March 2023.
Notably, the difference in the first (December 2020) to the last recorded value (March 2023) yields a negative growth rate, indicative of an overall trend of decline over the time period. This tapering trend across recent years, coupled with occasional peaks and dips, suggests continued fluctuations for MANU’s current ratio in the foreseeable future.
The final number of 0.39 in March 2023 shows that while the company has recovered slightly from its lowest dip, it is still a fair distance from its December 2020 level. This underlines a need for strong financial management strategies to improve liquidity and overall financial health.
Six-Month Overview: Manchester United’s Share Price Experienced Moderate Fluctuations
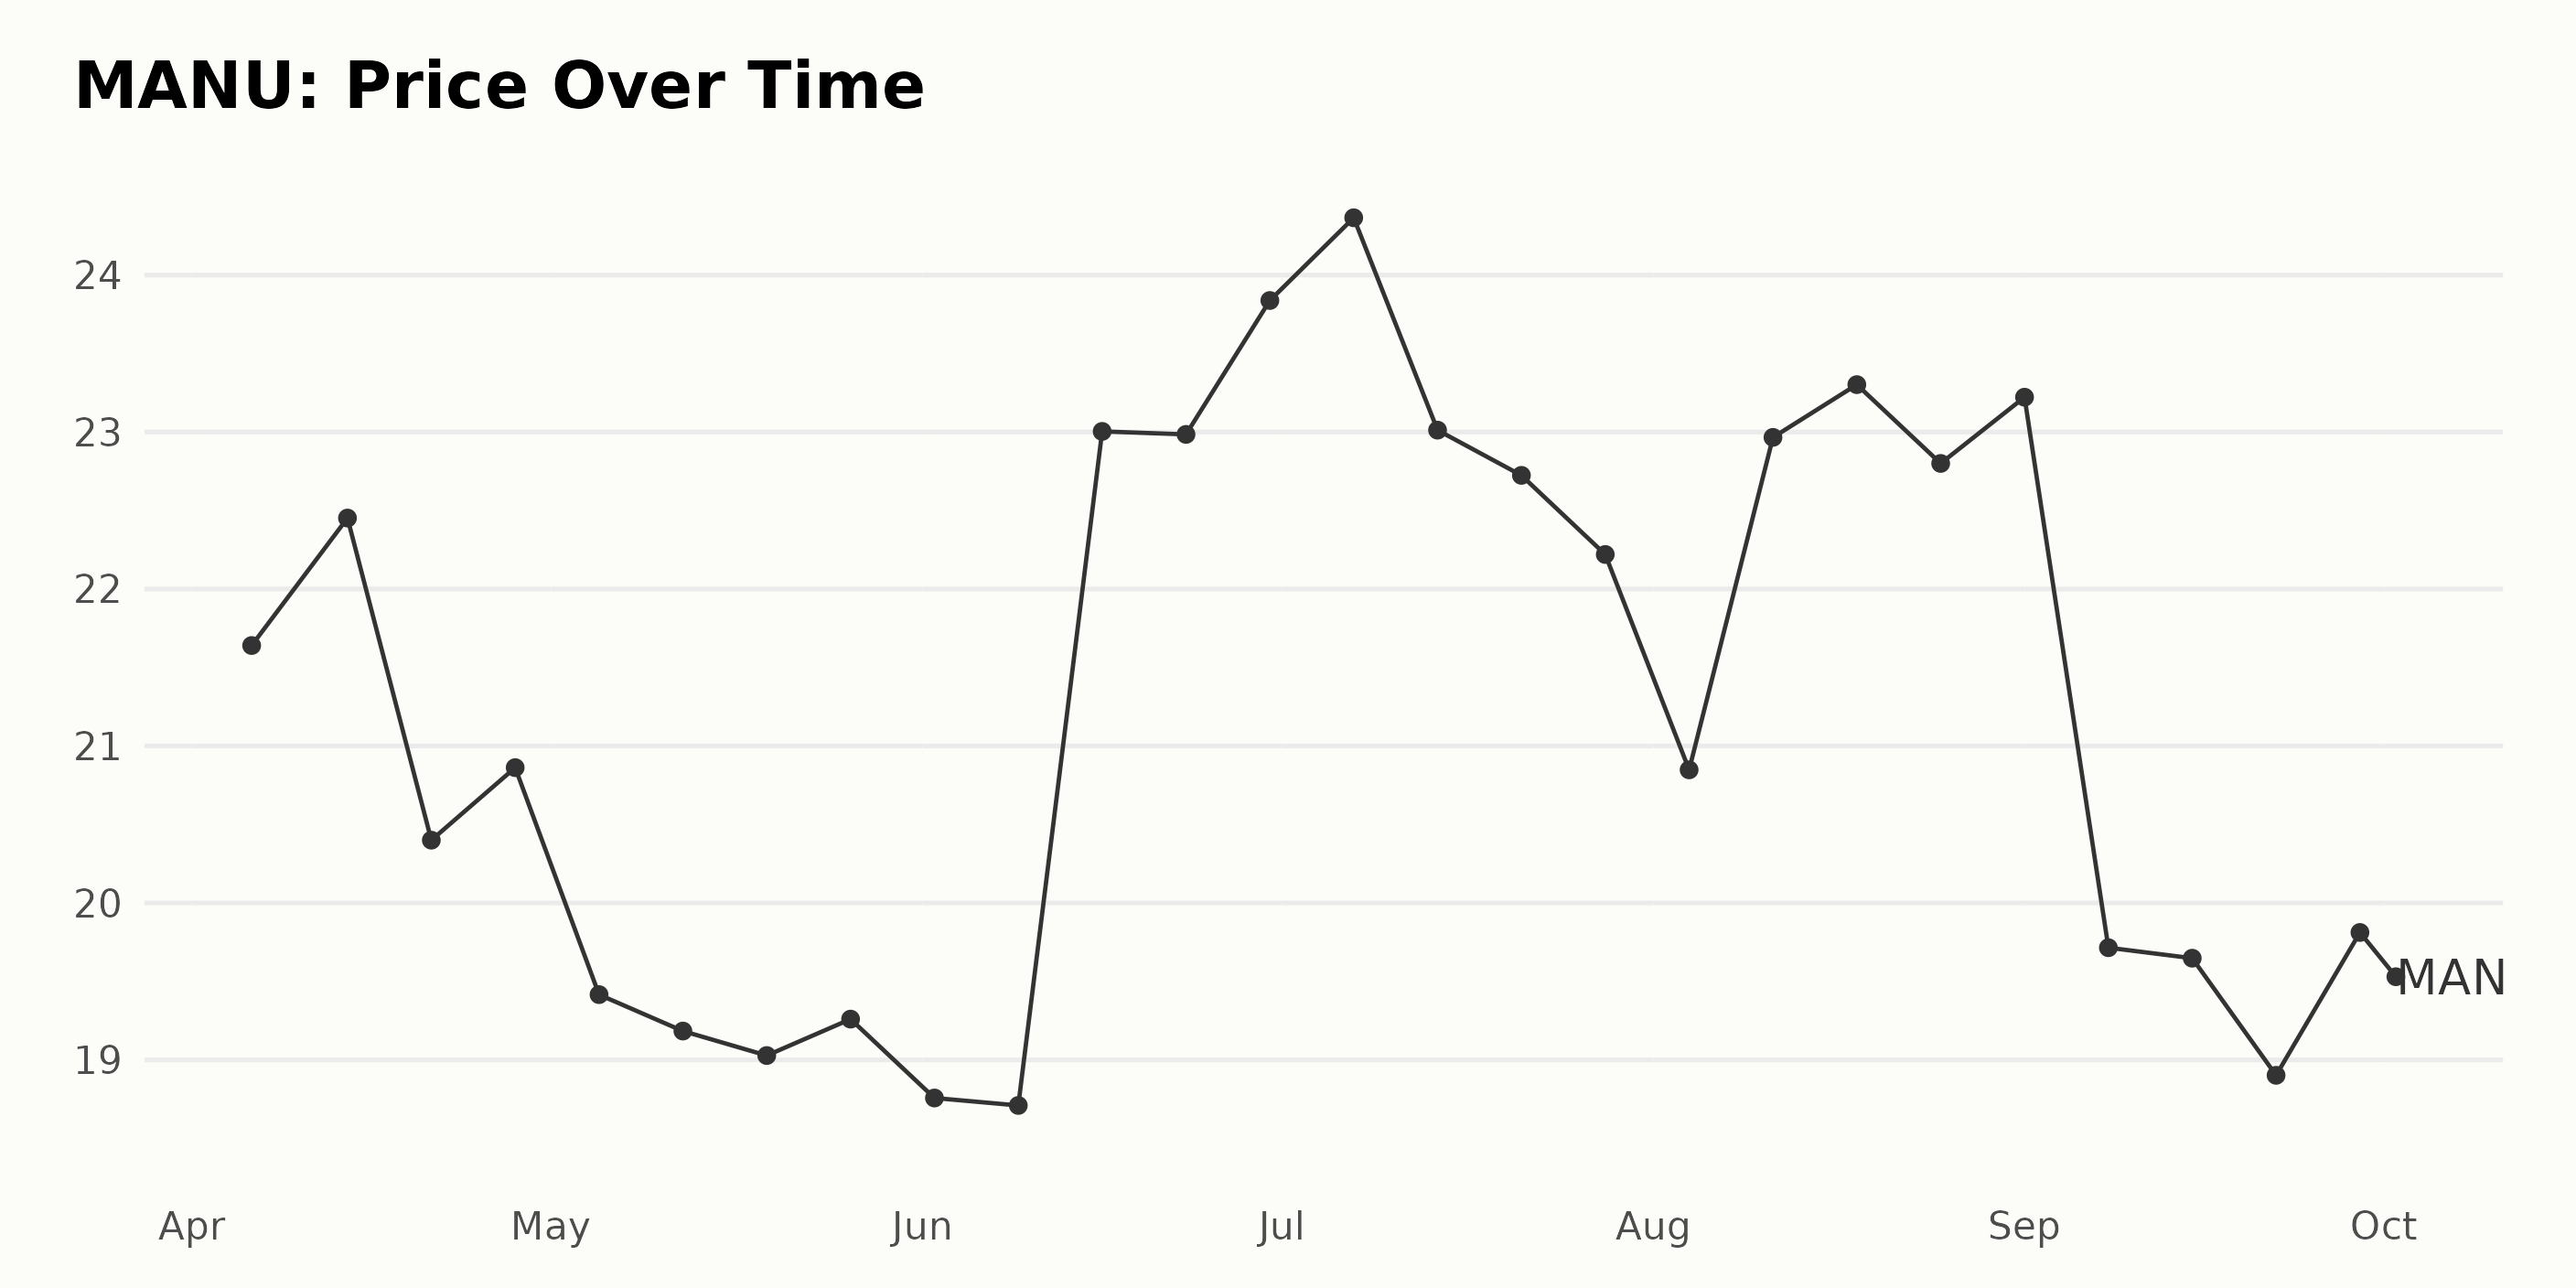
The share price of MANU between April 2023 and October 2023 depicted a trend of moderate fluctuations and displayed no prominent acceleration or deceleration. Below are some significant observations:
- On April 6, 2023, the share price started at $21.64.
- There was an increase over the first two weeks of April, peaking at $22.45 on April 14 before falling to $20.4 on April 21.
- Throughout May 2023, the price experienced a general decline, reaching as low as $18.71 in mid-June.
- The price then demonstrated a significant uptick from mid-June, reaching a high of $24.37 by July 7. However, the second half of July saw a drop in prices, falling to $22.22.
- The prices varied across August, with values hovering around the early $20s, peaking at $23.30 on August 18. The price then dropped, decreasing firstly to the high $19s in early September.
- Prices stayed relatively stagnant in September but saw another moderate increase towards its end, peaking at $19.81 on September 29th.
- Finally, the share price closed slightly down at $19.41 by October 2, 2023.
In summary, the stock exhibited relative volatility over the observed period. Prices seemed to experience peaks and troughs, remaining within the range of $18 to $24. While fluctuations are evident, no consistent growth or downfall pattern is perceivable at this point. Here is a chart of MANU’s price over the past 180 days.
Analyzing Manchester United’s Growth, Momentum, and Market Sentiment through POWR Ratings
The latest POWR Ratings grade for MANU is D (Sell). The company is placed last in the Entertainment – Sports & Theme Parks category, which consists of a total of 15 stocks. Here are some key points:
- From April 8, 2023, until July 1, 2023, MANU maintained an F (Strong Sell) grade, with its rank in the category fluctuating between #13 and #14.
- Starting from July 1, 2023, there was an improvement as the POWR grade elevated to D (Sell). Along with this, the company’s rank in the category also improved slightly, reaching as high as #11 by the week of July 29, 2023.
- However, by the week of August 19, 2023, the rank started to decline again, landing at the bottom of the category (rank #15) by the week of August 26, 2023. The D (Sell) grade and position at the bottom persisted through most of September.
- On the week of September 23, 2023, the POWR grade dropped back down to F (Strong Sell). This grade remained through the end of the month, with MANU also retaining its last place in the category ranking.
Overall, the POWR grade and rank in category data suggest that MANU has been persistently underperforming compared to other stocks in the Entertainment – Sports & Theme Parks category during this period.
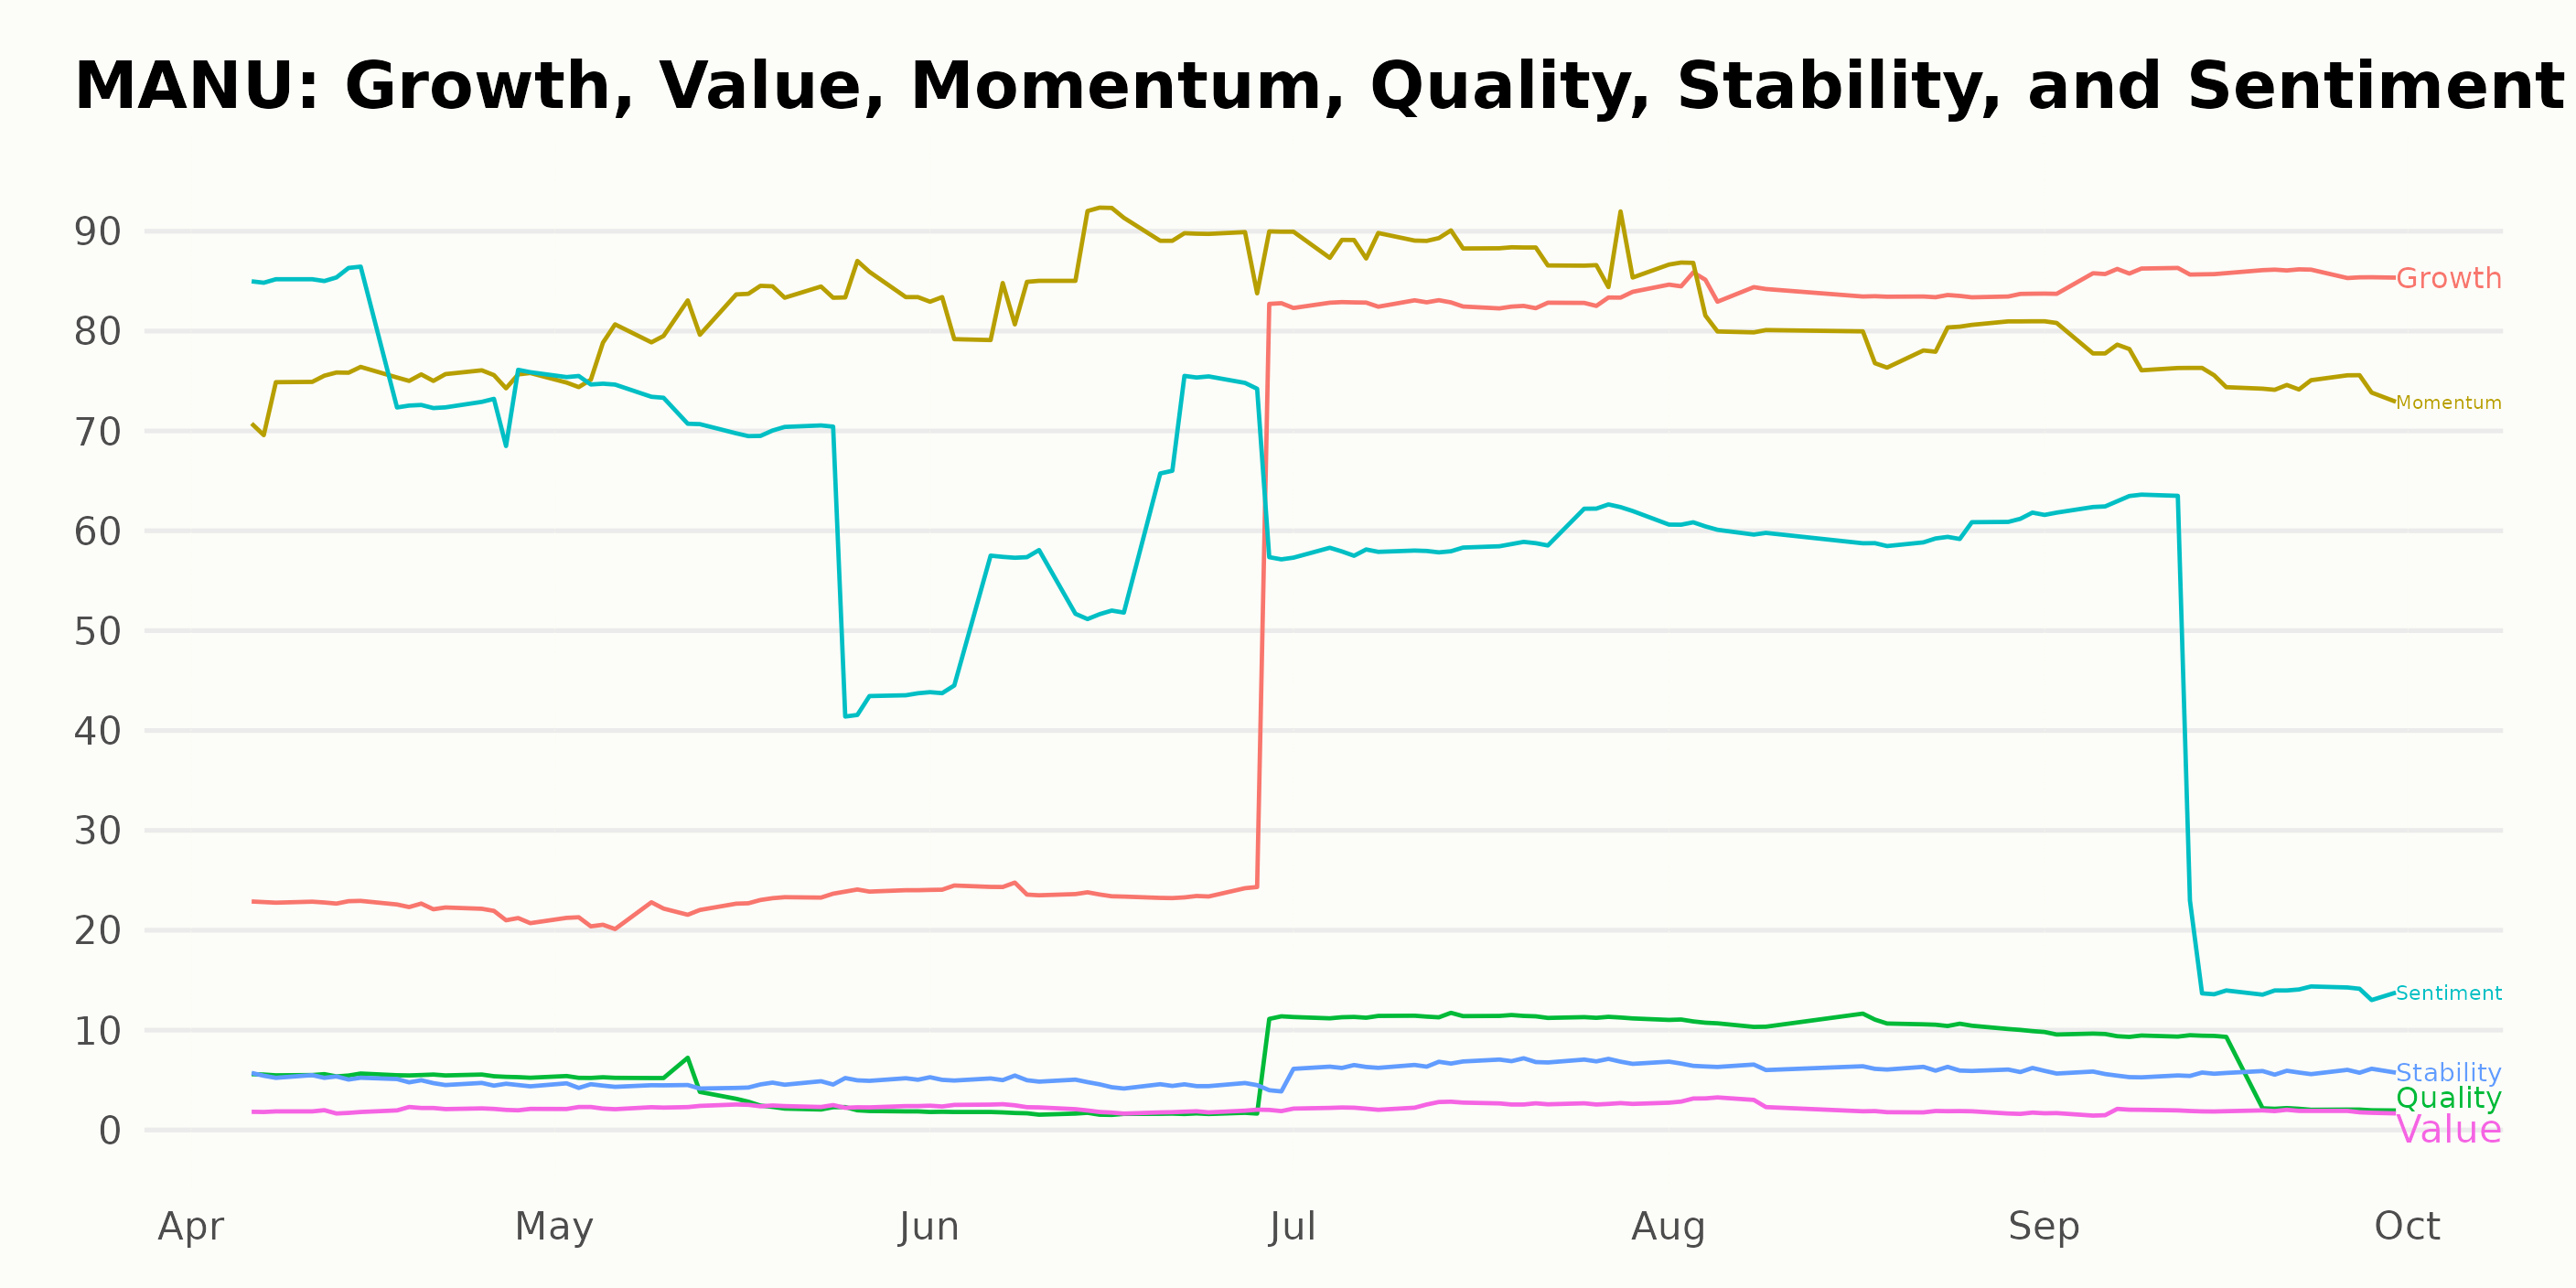
The POWR Ratings offer a comprehensive analysis of MANU along six dimensions: Growth, Momentum, Quality, Sentiment, Stability, and Value. After analyzing the given ratings, three dimensions stand out as noteworthy: Growth, Momentum, and Sentiment.
- Growth: This refers to the Growth potential and performance of MANU. This metric started at 22 in April 2023, then incrementally increased in the following months, peaking at 86 in September 2023. This represents a clear trend of significant growth, with an increase of over 300%.
- Momentum: The Momentum rating shows sharp fluctuations for MANU but mostly follows an upward trajectory. From an initial rating of 75 in April 2023, it peaked at 88 in July 2023. However, it later slightly declined to 76 by the end of September 2023.
- Sentiment: This details market sentiment about MANU. The Sentiment reached its peak at 78 in April 2023, then experienced a downward trend, reaching the lowest point of 33 in September 2023.
These three dimensions provide useful insights into the growth potential, market traction, and sentiment towards MANU over this period.
How does Manchester United plc (MANU) Stack Up Against its Peers?
Other stocks in the Entertainment – Casinos/Gambling sector that may be worth considering are Inspired Entertainment, Inc. (INSE), International Game Technology PLC (IGT), and Accel Entertainment, Inc. (ACEL) – they have better POWR Ratings. Click here to explore more stocks in the Entertainment – Casinos/Gambling industry.
What To Do Next?
Get your hands on this special report with 3 low priced companies with tremendous upside potential even in today’s volatile markets:
3 Stocks to DOUBLE This Year >
Want More Great Investing Ideas?
MANU shares were trading at $18.86 per share on Tuesday morning, down $0.55 (-2.83%). Year-to-date, MANU has declined -19.16%, versus a 11.30% rise in the benchmark S&P 500 index during the same period.
About the Author: Anushka Dutta

Anushka is an analyst whose interest in understanding the impact of broader economic changes on financial markets motivated her to pursue a career in investment research. More...
More Resources for the Stocks in this Article
| Ticker | POWR Rating | Industry Rank | Rank in Industry |
| MANU | Get Rating | Get Rating | Get Rating |
| INSE | Get Rating | Get Rating | Get Rating |
| IGT | Get Rating | Get Rating | Get Rating |
| ACEL | Get Rating | Get Rating | Get Rating |