

The stock market has been incredibly resilient, shrugging off both slowing economic data and potentially explosive geopolitical events.
The market is already up some 2.5% in just the first two weeks of the year. I’ve already seen two market prognosticators pull their sale of their 2020 Outlook because half of the names on their buy list have already hit the annual price targets. Granted, they did go with momo names like “Tesla (TSLA)” and “Beyond Meat (BYND)” which are up 30% and 50% respectively since the beginning of the year.
And while there is a sense of growing euphoria, or at least that this bull can do no wrong, the rise has been relatively orderly.
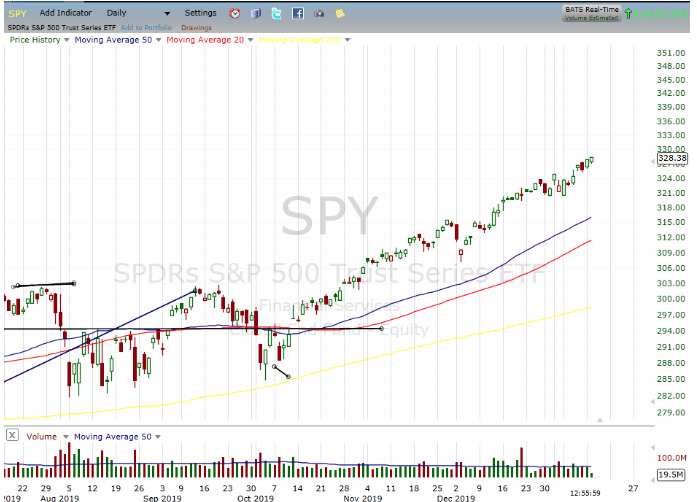
Indeed, since a breakout in mid-October in which “SPDR S&P 500 (SPY - Get Rating)” has gained some 10%, 87% of the days have been positive. Only two days have posted moves in excess of 1% and they were both down days.
It’s simply an exorable march higher, which has probably frustrated bulls (and of course, devastated bears) as there have been no pullbacks to buy.
While it seems like clear sailing ahead, a few red flags have been emerging. Here are 3 things concerning me:
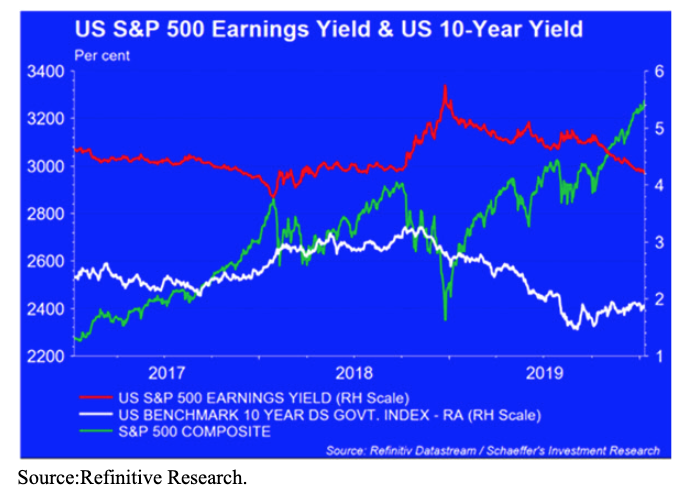
1. Most of the market gains, over the past few months, have come from multiple expansion. That is the SPY going from trading 16x forward in June of 2019 earnings, to a current 19x forward earnings.
This has occurred even as earnings growth has actually declined. Plus, bond yields, which when they were near zero, created a Fear Of Missing Out (FOMO), have crept up higher. The 10-Year Note is now yielding 1.9% and is starting to offer a more attractive risk-free rate of return.
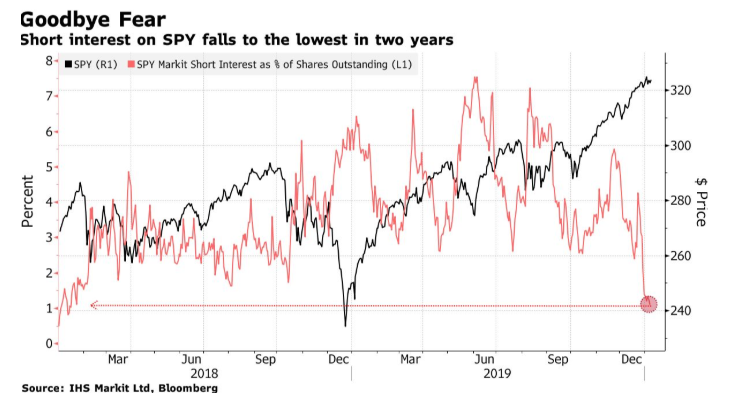
2.Bye, Bye Bears. While there may not be euphoria there also are barely any bears left.
Multiple measures show that nearly all shorts have been knocked out and are no longer betting on a sell-off.
Short interest in the SPY has fallen to a two-year low and is now the third-lowest treading in a decade.
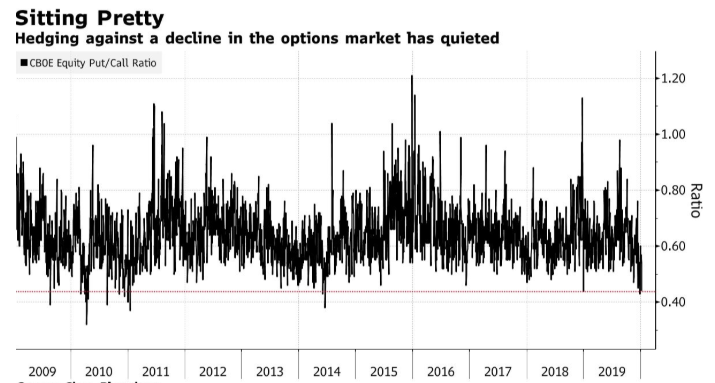
Option-based sentiment indicators, such as the put/call ratio, or the “CBOE Volatility Index (VIX),” have also moved to overly bullish readings. This is usually a contrary indicator.
There has actually been a rush into buying upside calls and a near abandonment of placing downside put protection. If a sell-off does come, people without the safety net of portfolio protection are more likely to panic. Which would create a self-fulling cascade of selling.
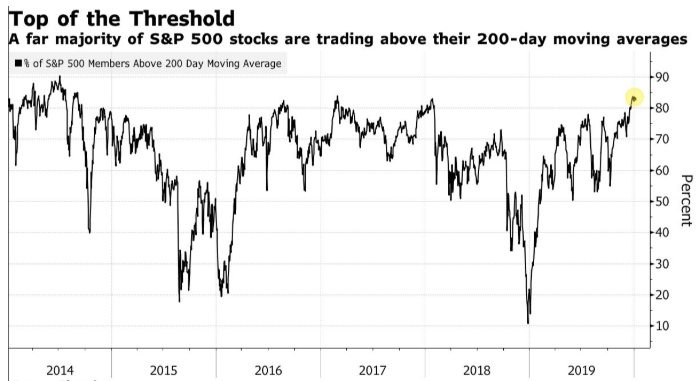
3. The market is extended, overbought or whatever term you want to use. Many stocks, including mega-cap “Apple (AAPL)” have turned parabolic. At some point, the trend will need to break.
Currently, over 80% of stocks are trading above their 200 day moving average and nearly 35% are trading 25% above their 50 dma. This is pushing the limits of extremely overbought.
The stock market is certainly in a new bull phase and has a variety of long-term tailwinds. But, I’m turning increasingly cautious in the short term.
SPY shares were trading at $326.99 per share on Tuesday afternoon, down $0.96 (-0.29%). Year-to-date, SPY has gained 1.59%, versus a 1.59% rise in the benchmark S&P 500 index during the same period.
About the Author: Option Sensei

Steve has more than 30 years of investment experience with an expertise in options trading. He’s written for TheStreet.com, Minyanville and currently for Option Sensei. Learn more about Steve’s background, along with links to his most recent articles. More...
More Resources for the Stocks in this Article
| Ticker | POWR Rating | Industry Rank | Rank in Industry |
| SPY | Get Rating | Get Rating | Get Rating |


