

Oil has posted a strong rebound off the March lows. Is this just an oversold bounce or the start of a bull market?
Sentiment and investor positioning indicates that most don’t believe that oil is on the verge of a new bull market. However, under the surface, we are seeing major changes in the supply and demand dynamics. We’ve also reached historical extremes that marked previous, turning points.
The best opportunity may lie in energy stocks which are seeing massive amounts of insider buying in addition to extreme levels of undervaluation.
First, let’s see how we got here, and then, why the ingredients are in place for a rally in oil stocks.
Recent Price Action
Oil has had a wild year in 2020. Oil started the year at $65 and was moving lower in January and February due to a price war between Saudi Arabia and Russia. Then oil crashed, along with other assets, in March, as major economies shut down in response to the coronavirus.

However, prices have recovered as oil production was sharply cut. The strong rebound and stability in oil prices is an indication that we are at an equilibrium between supply and demand.
Since the beginning of June, oil has been trading in a tight range with little volatility. This is a stark difference from the huge moves it made earlier in the year. At some point, there’s going to be a big move to the upside or downside.
I believe the odds favor an upside breakout in the short-term. It’s also likely that oil prices and energy stocks will be significantly higher in the coming years due to supply and demand dynamics, investors positioning, and historical extremes in relative value.
Investors should consider a position in a high-quality, diversified oil company like Exxon Mobil (XOM - Get Rating), a driller like Schlumberger (SLB - Get Rating) with more risk and upside, or an energy ETF like the Energy Select SPDR Fund (XLE - Get Rating). An ETF that tracks crude oil is the U.S. Oil Fund (USO - Get Rating).
Setups
All of these stocks are attractive from multiple perspectives on multiple timeframes.

Like oil, XOM has been range-bound over the past month. It seems to have support at $40 which creates a low-risk, short-term trade.
For longer-term investors, it’s attractive due to its strong fundamentals. The weakness in oil has led to consolidation in the space and many smaller players going bankrupt. Large companies like XOM are able to scoop up assets at a discount which will pay off when conditions improve.
Despite the weakness in oil, XOM has remained profitable and pays an 8.5% dividend.
Another interesting option at the other end of the risk-spectrum is the drillers like Schlumberger. These stocks have more upside if prices do rise. However, there’s more risk if prices remain low.
In the last quarter, SLB lost $2.2 billion. Its stock is down 55% from its YTD highs and 57% above its March lows.

Short-term traders could consider getting long the stock with a stop-loss at $17. SLB could see an aggressive rebound if oil prices break higher from its recent range.
XLE is an option for long-term investors who want exposure to energy. It’s composed of a variety of different energy companies including refiners, drillers, oil services, and pipeline stocks. However, in the long-term, it’s correlated with oil prices. Currently, it pays a staggering 11% dividend.
Supply-Demand Dynamics
There’s little interest or excitement for energy stocks or oil. However, there’s increasing evidence of tightness in the oil markets.
The most obvious is how oil has bounced back despite the drop in demand. Another factor is the contango in oil prices in which future prices are lower than front-month prices. This is an indication of a tight market that could jump higher if demand increases or supply drops.
In terms of supply, OPEC cut production by 8million barrels per day. Non-OPEC production, composed of shale, offshore drilling, and oil sands, declined by another 5 million barrels per day.
This is unlikely to come back. In fact, it seems likely to drop further given the drop in rig counts all over the world. In the US, rig counts have dropped by 75%. Rig counts are a leading indicator of production, meaning that non-OPEC production is going to be lower in the future until we get much higher prices.
In contrast, oil demand has been much more resilient than expected. Currently, it’s only 10 million barrels per day lower than in February. Most forecasts were for a decline between 20 to 30 million barrels per day.
Positioning
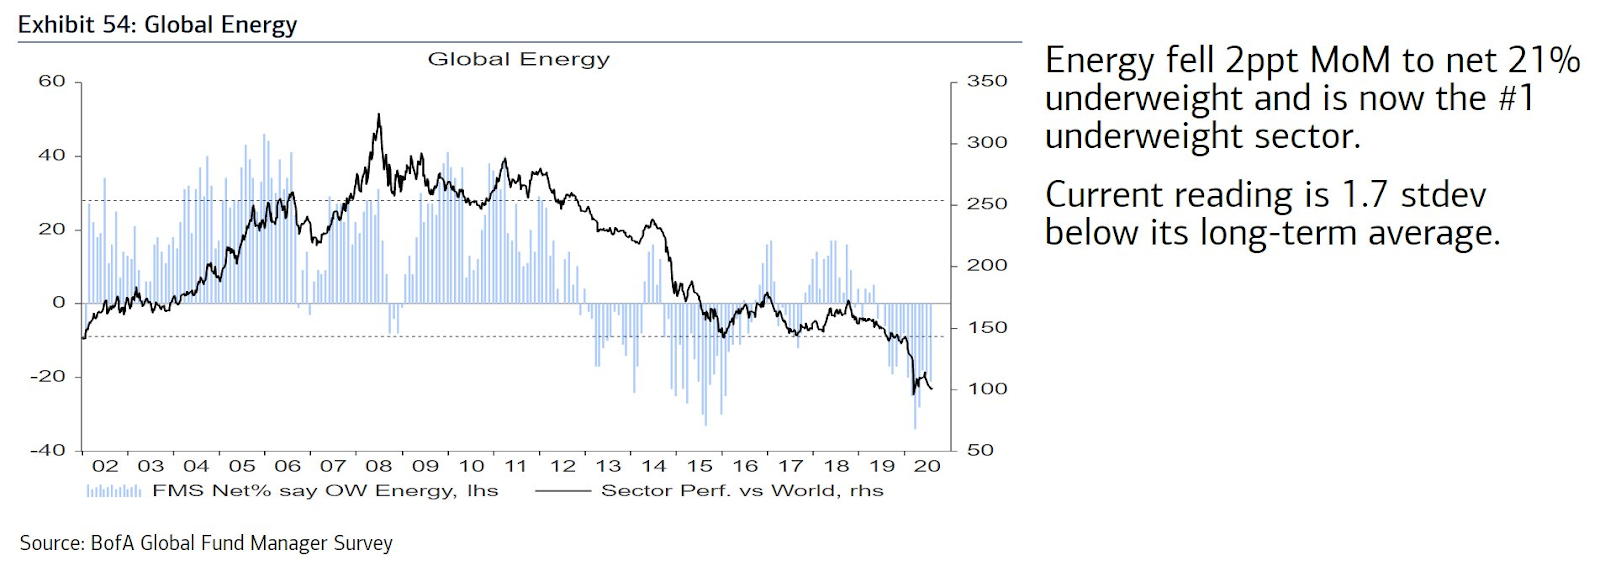
In addition to these bullish developments of decreasing production, we have investor positioning at record lows. This is evident from the Bank of America Global Fund Manager Survey which shows that investors are 21% underweight the sector which is 1.7 standard deviations below the long-term average.
While positioning is low, insider buying in energy stocks is off the charts.
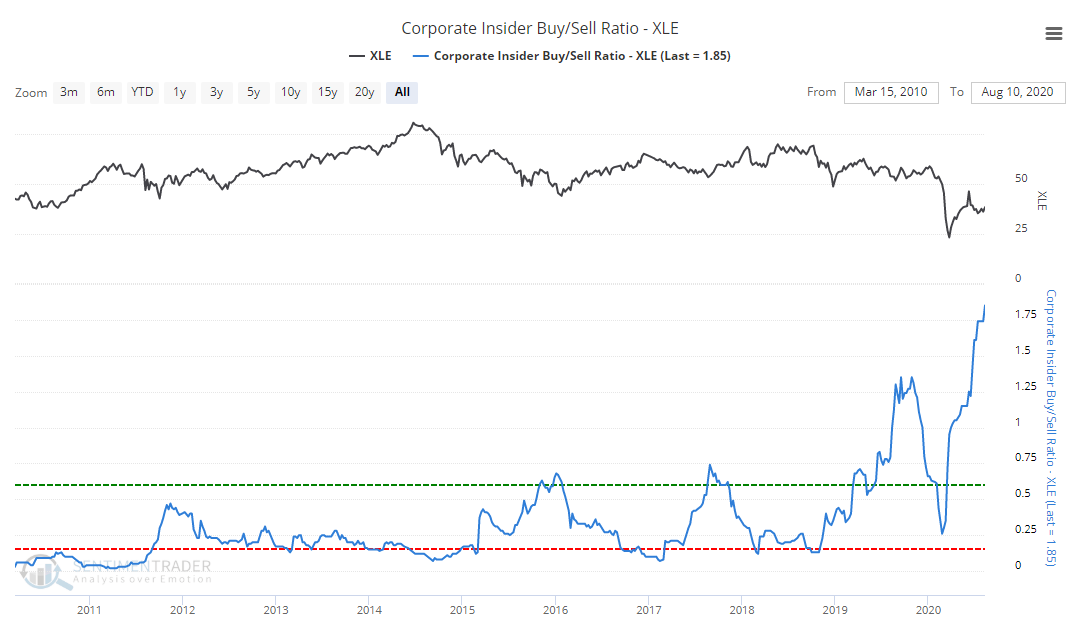
(source: SentimenTrader)
This is an interesting situation. Insiders are scooping up discounted shares, while investors have lost interest in the sector due to its underperformance.
Insiders are not always right, but they know the business better than everyone else. It’s a meaningful signal that they are putting their own hard-earned cash to work.
They were wrong in late-2019 as the OPEC price war and coronavirus led to oil and energy stock crashing, but they were right in 2011, 2016, and 2017.
Historical extremes
We’re reaching historical extremes in oil prices relative to other asset classes. In the past when these extremes were hit, it was a reliable indicator that mean-reversion was on the horizon.
Below is a chart of the ratio of gold to crude oil. It shows how many barrels of oil you could buy with one ounce of gold.

(source: macrotrends.com)
Currently, it’s around 50. Historically, it fluctuated between 10 and 30. This chart indicates that oil is likely to outperform gold in the coming years.
Similarly, the ratio of oil to the S&P 500 is also at levels that have correlated to oil outperforming stocks.

The weighting of energy stocks in the S&P 500 of around 3% is also at historical extremes. In contrast, it hit a weight of 16% when oil peaked in 2008. Historically, it’s averaged around 8%.
Closing Thoughts
A little more than 20 years ago, the world was going crazy for technology stocks and ignoring oil. Over the next decade, oil climbed from $20 to over $150.
During that period, there was persistent underinvestment in oil which resulted in prices spiking due to strong demand.
We have a similar situation today. Oil production is set to trend lower, while demand is stronger than expected. Investment in new projects and drilling activity has dried up due to the coronavirus and inventories getting filled up.
However, these factors are creating the conditions for oil prices and oil stocks to climb higher over the next, few years.
Want More Great Investing Ideas?
2 Step Process to Sell @ Market Top in September
9 “BUY THE DIP” Growth Stocks for 2020
USO shares . Year-to-date, USO has declined -70.38%, versus a 7.64% rise in the benchmark S&P 500 index during the same period.
About the Author: Jaimini Desai

Jaimini Desai has been a financial writer and reporter for nearly a decade. His goal is to help readers identify risks and opportunities in the markets. He is the Chief Growth Strategist for StockNews.com and the editor of the POWR Growth and POWR Stocks Under $10 newsletters. Learn more about Jaimini’s background, along with links to his most recent articles. More...
More Resources for the Stocks in this Article
| Ticker | POWR Rating | Industry Rank | Rank in Industry |
| USO | Get Rating | Get Rating | Get Rating |
| XOM | Get Rating | Get Rating | Get Rating |
| SLB | Get Rating | Get Rating | Get Rating |
| XLE | Get Rating | Get Rating | Get Rating |


