Agilent Technologies Inc. (A): Price and Financial Metrics
A Price/Volume Stats
Current price | $112.00 | 52-week high | $160.26 |
Prev. close | $110.50 | 52-week low | $109.00 |
Day low | $110.44 | Volume | 1,959,900 |
Day high | $112.68 | Avg. volume | 1,778,832 |
50-day MA | $120.11 | Dividend yield | 0.8% |
200-day MA | $132.55 | Market Cap | 32.77B |
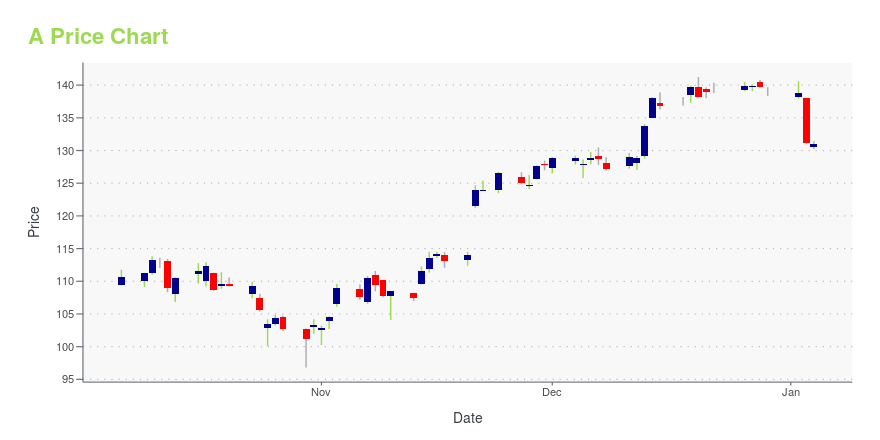
A Stock Price Chart Interactive Chart >
A POWR Grades
- Quality is the dimension where A ranks best; there it ranks ahead of 89.95% of US stocks.
- A's strongest trending metric is Growth; it's been moving down over the last 177 days.
- A's current lowest rank is in the Momentum metric (where it is better than 12.19% of US stocks).
A Stock Summary
- AGILENT TECHNOLOGIES INC's market capitalization of $32,597,148,085 is ahead of 92.94% of US-listed equities.
- The price/operating cash flow metric for AGILENT TECHNOLOGIES INC is higher than 75.57% of stocks in our set with a positive cash flow.
- A's price/sales ratio is 4.66; that's higher than the P/S ratio of 79.01% of US stocks.
- If you're looking for stocks that are quantitatively similar to AGILENT TECHNOLOGIES INC, a group of peers worth examining would be HOLX, HZNP, LOGI, RMD, and ALGN.
- Visit A's SEC page to see the company's official filings. To visit the company's web site, go to www.agilent.com.
A Valuation Summary
- In comparison to the median Healthcare stock, A's price/earnings ratio is 7.87% higher, now standing at 28.8.
- Over the past 243 months, A's price/sales ratio has gone up 2.9.
Below are key valuation metrics over time for A.
Stock | Date | P/S | P/B | P/E | EV/EBIT |
---|---|---|---|---|---|
A | 2023-09-22 | 4.7 | 5.9 | 28.8 | 23.2 |
A | 2023-09-21 | 4.6 | 5.8 | 28.3 | 22.8 |
A | 2023-09-20 | 4.7 | 5.9 | 29.0 | 23.4 |
A | 2023-09-19 | 4.7 | 5.9 | 29.0 | 23.3 |
A | 2023-09-18 | 4.7 | 5.9 | 29.1 | 23.4 |
A | 2023-09-15 | 4.8 | 6.1 | 29.9 | 24.1 |
A Growth Metrics
- Its 5 year revenue growth rate is now at 21.09%.
- The 4 year net cashflow from operations growth rate now stands at 0.5%.
- The 2 year cash and equivalents growth rate now stands at -10.42%.

The table below shows A's growth in key financial areas (numbers in millions of US dollars).
Date | Revenue | Operating Cash Flow | Net Income to Common Stock |
---|---|---|---|
2022-09-30 | 6,848 | 1,312 | 1,254 |
2022-06-30 | 6,659 | 1,305 | 1,328 |
2022-03-31 | 6,527 | 1,313 | 1,263 |
2021-12-31 | 6,445 | 1,502 | 1,205 |
2021-09-30 | 6,319 | 1,485 | 1,210 |
2021-06-30 | 6,142 | 1,421 | 990 |
A's Quality Factors
The “Quality” component of the POWR Ratings focuses on 31 different factors of a companies fundamentals and operational strength. Here are some key insights as we drill into the specifics of these quality attributes.- A has a Quality Grade of B, ranking ahead of 88.35% of graded US stocks.
- A's asset turnover comes in at 0.611 -- ranking 39th of 76 Measuring and Control Equipment stocks.
- FEIM, FLDM, and TMO are the stocks whose asset turnover ratios are most correlated with A.
The table below shows A's key quality metrics over time.
Period | Asset Turnover | Gross Margin | ROIC |
---|---|---|---|
2021-07-31 | 0.611 | 0.536 | 0.258 |
2021-04-30 | 0.593 | 0.535 | 0.242 |
2021-01-31 | 0.578 | 0.534 | 0.221 |
2020-10-31 | 0.560 | 0.531 | 0.208 |
2020-07-31 | 0.550 | 0.533 | 0.207 |
2020-04-30 | 0.566 | 0.536 | 0.225 |
A Price Target
For more insight on analysts targets of A, see our A price target page. And for a list of of all stocks sorted by upside potential based on analyst target price, see our Top Price Target page.
Average Price Target | $175.41 | Average Broker Recommendation | 1.44 (Moderate Buy) |
Agilent Technologies Inc. (A) Company Bio
Agilent Technologies, Inc. is an American analytical instrumentation development and manufacturing company that offers its products and services to markets worldwide. Its global headquarters is located in Santa Clara, California. Agilent was established in 1999 as a spin-off from Hewlett-Packard. The resulting IPO of Agilent stock was the largest in the history of Silicon Valley at the time. (Source:Wikipedia)
Latest A News From Around the Web
Below are the latest news stories about AGILENT TECHNOLOGIES INC that investors may wish to consider to help them evaluate A as an investment opportunity.
7 Value Stocks That Should Be on Every Investor’s Radar This FallWith higher interest rates well into 2024, institutional money is likely to flow back into some of the best value stocks. |
3 Stocks Delivering $2.8 Billion in Dividends to Warren Buffett Each YearJust three Warren Buffett dividend stocks account for nearly half of all the dividend payments Berkshire Hathaway will receive in 2023. |
7 Long-Term Stocks That Should Be on Every Investor’s Radar This FallThese long-term stocks are essential for crafting a balanced portfolio that'll consistently generate high returns for decades. |
7 Warren Buffett Stocks That Should Be On Every Investor’s Radar This FallEach time Buffett buys or sells a stock, it makes news headlines. |
Agilent Announces Cash Dividend of 22.5 Cents Per ShareSANTA CLARA, Calif., September 20, 2023--Agilent Technologies, Inc. (NYSE: A) today announced that a quarterly dividend of 22.5 cents per share of common stock will be paid on Oct. 25, 2023, to all shareholders of record as of the close of business on Oct. 3, 2023. |
A Price Returns
1-mo | -8.71% |
3-mo | -6.86% |
6-mo | -18.75% |
1-year | -8.13% |
3-year | 13.89% |
5-year | 64.70% |
YTD | -24.89% |
2022 | -5.52% |
2021 | 35.51% |
2020 | 39.79% |
2019 | 27.54% |
2018 | 1.67% |
A Dividends
Ex-Dividend Date | Type | Payout Amount | Change | ||||||
---|---|---|---|---|---|---|---|---|---|
Loading, please wait... |
Continue Researching A
Want to see what other sources are saying about Agilent Technologies Inc's financials and stock price? Try the links below:Agilent Technologies Inc (A) Stock Price | Nasdaq
Agilent Technologies Inc (A) Stock Quote, History and News - Yahoo Finance
Agilent Technologies Inc (A) Stock Price and Basic Information | MarketWatch
Loading social stream, please wait...