
Asbury Automotive Group Inc (ABG): Price and Financial Metrics
ABG Price/Volume Stats
| Current price | $254.21 | 52-week high | $259.67 |
| Prev. close | $249.45 | 52-week low | $178.40 |
| Day low | $249.44 | Volume | 170,900 |
| Day high | $255.63 | Avg. volume | 172,041 |
| 50-day MA | $236.25 | Dividend yield | N/A |
| 200-day MA | $219.32 | Market Cap | 5.13B |
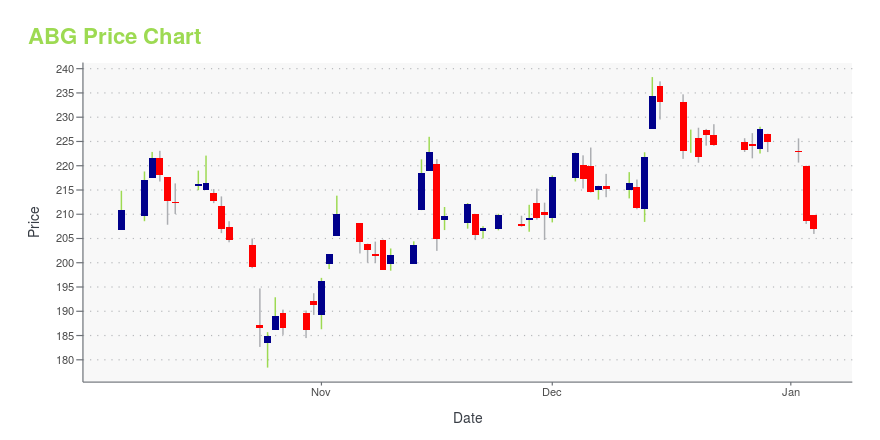
ABG Stock Price Chart Interactive Chart >
Asbury Automotive Group Inc (ABG) Company Bio
Asbury Automotive Group operates as an automotive retailer in the United States. It offers a range of automotive products and services, including new and used vehicles; vehicle maintenance, replacement parts, and collision repair services; and aftermarket products, such as financing, insurance, and service contracts. The company was founded in 1995 and is based in Duluth, Georgia.
Latest ABG News From Around the Web
Below are the latest news stories about ASBURY AUTOMOTIVE GROUP INC that investors may wish to consider to help them evaluate ABG as an investment opportunity.
13 Cash-Rich Small Cap Stocks To Invest InIn this piece, we will take a look at the 13 cash rich small cap stocks to invest in. If you want to skip our introduction to small cap investing and the latest stock market news, then you can take a look at the 5 Cash-Rich Small Cap Stocks To Invest In. Small cap stocks […] |
Auto Roundup: GM's Cruise Layoff Update, BLBD's Quarterly Release & MoreWhile General Motors' Cruise trims its workforce by 24%, Blue Bird (BLBD) delivers a comprehensive beat for the fiscal fourth quarter of 2023 and raises fiscal 2024 forecasts. |
12 Most Promising Car Stocks According to AnalystsIn this article, we discuss the 12 most promising car stocks according to analysts. To skip the detailed analysis of the automotive industry, go directly to the 5 Most Promising Car Stocks According to Analysts. The car industry has been one of the most important industries in the world since Henry Ford installed the first […] |
Insider Sell: Director Philip Maritz Sells Shares of Asbury Automotive Group Inc (ABG)Asbury Automotive Group Inc (NYSE:ABG), a prominent player in the automotive retail industry, has witnessed a recent insider transaction that has caught the attention of market analysts and investors alike. |
Strength Seen in Group 1 Automotive (GPI): Can Its 3.9% Jump Turn into More Strength?Group 1 Automotive (GPI) was a big mover last session on higher-than-average trading volume. The latest trend in earnings estimate revisions might not help the stock continue moving higher in the near term. |
ABG Price Returns
| 1-mo | 14.46% |
| 3-mo | 14.52% |
| 6-mo | 18.83% |
| 1-year | 14.94% |
| 3-year | 29.09% |
| 5-year | 184.18% |
| YTD | 13.00% |
| 2023 | 25.51% |
| 2022 | 3.77% |
| 2021 | 18.52% |
| 2020 | 30.44% |
| 2019 | 67.70% |
Continue Researching ABG
Want to see what other sources are saying about Asbury Automotive Group Inc's financials and stock price? Try the links below:Asbury Automotive Group Inc (ABG) Stock Price | Nasdaq
Asbury Automotive Group Inc (ABG) Stock Quote, History and News - Yahoo Finance
Asbury Automotive Group Inc (ABG) Stock Price and Basic Information | MarketWatch
Loading social stream, please wait...