Abbott Laboratories (ABT): Price and Financial Metrics
GET POWR RATINGS... FREE!
ABT POWR Grades
- ABT scores best on the Stability dimension, with a Stability rank ahead of 89.02% of US stocks.
- ABT's strongest trending metric is Growth; it's been moving down over the last 177 days.
- ABT ranks lowest in Growth; there it ranks in the 16th percentile.
ABT Stock Summary
- ABBOTT LABORATORIES's market capitalization of $193,100,795,803 is ahead of 99.14% of US-listed equities.
- ABBOTT LABORATORIES's stock had its IPO on January 1, 1986, making it an older stock than 93.46% of US equities in our set.
- In terms of volatility of its share price, ABT is more volatile than only 3.11% of stocks we're observing.
- If you're looking for stocks that are quantitatively similar to ABBOTT LABORATORIES, a group of peers worth examining would be DHR, TMO, SHEL, DIS, and AZN.
- ABT's SEC filings can be seen here. And to visit ABBOTT LABORATORIES's official web site, go to www.abbott.com.
ABT Valuation Summary
- In comparison to the median Healthcare stock, ABT's EV/EBIT ratio is 98.03% higher, now standing at 20.1.
- ABT's price/sales ratio has moved up 1 over the prior 243 months.
Below are key valuation metrics over time for ABT.
Stock | Date | P/S | P/B | P/E | EV/EBIT |
---|---|---|---|---|---|
ABT | 2023-01-30 | 4.3 | 5.3 | 24.3 | 20.1 |
ABT | 2023-01-27 | 4.3 | 5.3 | 24.3 | 20.2 |
ABT | 2023-01-26 | 4.3 | 5.4 | 24.5 | 20.4 |
ABT | 2023-01-25 | 4.3 | 5.4 | 24.5 | 20.3 |
ABT | 2023-01-24 | 4.4 | 5.5 | 24.9 | 20.6 |
ABT | 2023-01-23 | 4.4 | 5.5 | 25.2 | 20.9 |
ABT Growth Metrics
- The 5 year net cashflow from operations growth rate now stands at 91.66%.
- The 2 year cash and equivalents growth rate now stands at 127.27%.
- Its 4 year revenue growth rate is now at 53.91%.

The table below shows ABT's growth in key financial areas (numbers in millions of US dollars).
Date | Revenue | Operating Cash Flow | Net Income to Common Stock |
---|---|---|---|
2022-09-30 | 45,030 | 10,322 | 7,889 |
2022-06-30 | 45,548 | 10,243 | 8,554 |
2022-03-31 | 44,514 | 9,961 | 7,725 |
2021-12-31 | 43,075 | 10,533 | 7,071 |
2021-09-30 | 42,308 | 11,264 | 7,244 |
2021-06-30 | 40,233 | 10,629 | 6,376 |
ABT's Quality Factors
The “Quality” component of the POWR Ratings focuses on 31 different factors of a companies fundamentals and operational strength. Here are some key insights as we drill into the specifics of these quality attributes.- ABT has a Quality Grade of B, ranking ahead of 77.76% of graded US stocks.
- ABT's asset turnover comes in at 0.559 -- ranking 70th of 680 Pharmaceutical Products stocks.
- DVAX, RARE, and CORT are the stocks whose asset turnover ratios are most correlated with ABT.
The table below shows ABT's key quality metrics over time.
Period | Asset Turnover | Gross Margin | ROIC |
---|---|---|---|
2021-06-30 | 0.559 | 0.557 | 0.230 |
2021-03-31 | 0.527 | 0.568 | 0.205 |
2020-12-31 | 0.499 | 0.566 | 0.166 |
2020-09-30 | 0.473 | 0.567 | 0.135 |
2020-06-30 | 0.462 | 0.576 | 0.128 |
2020-03-31 | 0.473 | 0.584 | 0.147 |
ABT Price Target
For more insight on analysts targets of ABT, see our ABT price target page. And for a list of of all stocks sorted by upside potential based on analyst target price, see our Top Price Target page.
Average Price Target | $132.05 | Average Broker Recommendation | 1.48 (Moderate Buy) |
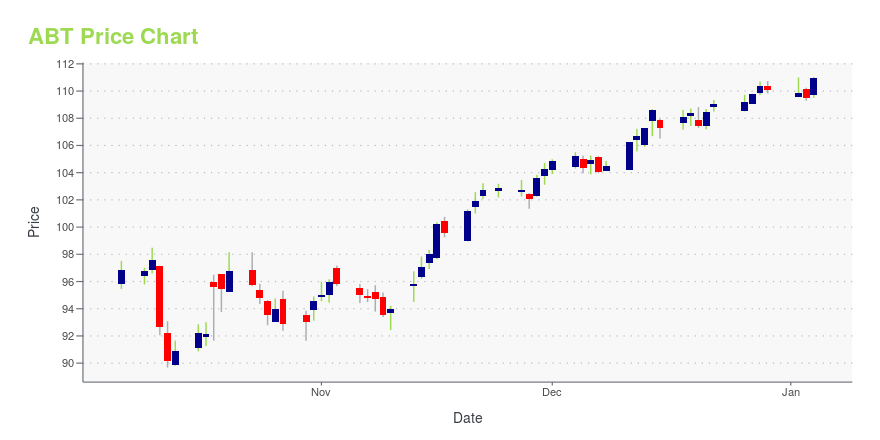
ABT Stock Price Chart Interactive Chart >
ABT Price/Volume Stats
Current price | $110.75 | 52-week high | $130.79 |
Prev. close | $110.75 | 52-week low | $93.25 |
Day low | $109.88 | Volume | 1,461,562 |
Day high | $112.22 | Avg. volume | 4,862,496 |
50-day MA | $109.71 | Dividend yield | 1.84% |
200-day MA | $107.49 | Market Cap | 193.10B |
Abbott Laboratories (ABT) Company Bio
Abbott Laboratories is an American multinational medical devices and health care company with headquarters in Abbott Park, Illinois, United States. The company was founded by Chicago physician Wallace Calvin Abbott in 1888 to formulate known drugs; today, it sells medical devices, diagnostics, branded generic medicines and nutritional products. It split off its research-based pharmaceuticals business into AbbVie in 2013. (Source:Wikipedia)
Latest ABT News From Around the Web
Below are the latest news stories about ABBOTT LABORATORIES that investors may wish to consider to help them evaluate ABT as an investment opportunity.
Ensign Group (ENSG) Shares Down 2% Since Q4 Earnings ReleaseEnsign Group's (ENSG) fourth-quarter results indicate higher skilled services revenue and improved occupancies, partly offset by the increased cost of services. |
Diabetes Deep-Dive With DexCom And Embecta: Polar Opposite Diabetes PlaysThe purpose of this article is three-fold: to give an overview of the diabetes value-chain; divergences in growth; and to identify two interesting businesses. DexCom (DXCM) is an exciting diabetes-focussed med-tech company solving neglected problems in an effective oligopoly with domestic (US) and international growth aplenty. Contrast this with Embecta (EMBC): an attractive business treated as a cash cow and underinvested in. The likes of DexCom signals the diabetes industry is transforming. Embecta has not, and no... |
2 Beaten-Down Stocks With Stable Dividends to Buy In 2023Here is one thing that separates the best dividend stocks from the rest. Two excellent examples are Abbott Laboratories (NYSE: ABT) and Medtronic (NYSE: MDT). Both are solid dividend stocks with strong, long-term outlooks. |
3 Unstoppable Dividend Stocks to Buy in FebruaryAny time is a good time to buy solid dividend stocks. Here's why they chose Abbott Laboratories (NYSE: ABT), AbbVie (NYSE: ABBV), and Johnson & Johnson (NYSE: JNJ). David Jagielski (Abbott Laboratories): One dividend stock that should be attractive to long-term investors is Abbott Laboratories. |
Abbott receives FDA, EMA authorizations for cardiac catheters (NYSE:ABT)Abbott Laboratories (ABT) has launched its TactiFlex ablation catheter (sensor enabled) in Europe after receiving CE Mark.The company said that TactiFlex can reduce procedure… |
ABT Price Returns
1-mo | -0.96% |
3-mo | 11.86% |
6-mo | 1.16% |
1-year | -11.97% |
3-year | 32.22% |
5-year | 113.63% |
YTD | 1.33% |
2022 | -20.68% |
2021 | 30.53% |
2020 | 28.04% |
2019 | 22.08% |
2018 | 29.06% |
ABT Dividends
Ex-Dividend Date | Type | Payout Amount | Change | ||||||
---|---|---|---|---|---|---|---|---|---|
Loading, please wait... |
Continue Researching ABT
Here are a few links from around the web to help you further your research on Abbott Laboratories's stock as an investment opportunity:Abbott Laboratories (ABT) Stock Price | Nasdaq
Abbott Laboratories (ABT) Stock Quote, History and News - Yahoo Finance
Abbott Laboratories (ABT) Stock Price and Basic Information | MarketWatch
Loading social stream, please wait...