AudioCodes Ltd. (AUDC): Price and Financial Metrics
AUDC Price/Volume Stats
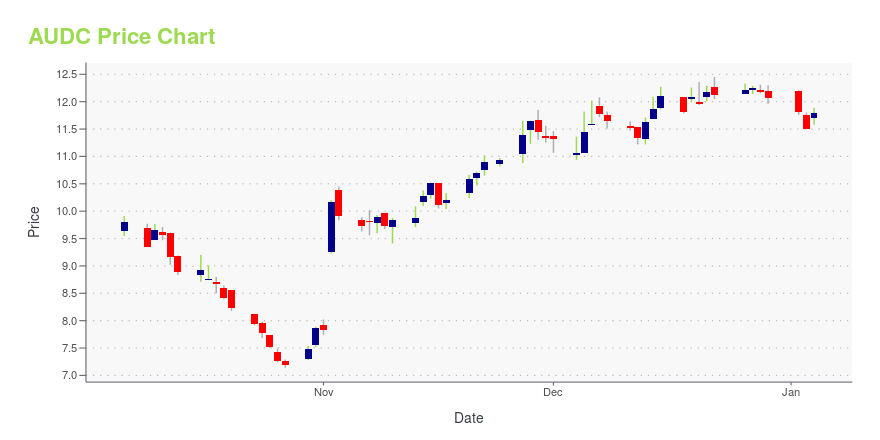
Current price | $10.02 | 52-week high | $22.56 |
Prev. close | $10.30 | 52-week low | $8.05 |
Day low | $9.88 | Volume | 177,600 |
Day high | $10.23 | Avg. volume | 177,482 |
50-day MA | $10.48 | Dividend yield | 3.6% |
200-day MA | $12.64 | Market Cap | 317.52M |
AUDC Stock Price Chart Interactive Chart >
AUDC POWR Grades
- Quality is the dimension where AUDC ranks best; there it ranks ahead of 97.39% of US stocks.
- AUDC's strongest trending metric is Stability; it's been moving down over the last 178 days.
- AUDC ranks lowest in Growth; there it ranks in the 2nd percentile.
AUDC Stock Summary
- For AUDC, its debt to operating expenses ratio is greater than that reported by merely 12.63% of US equities we're observing.
- With a year-over-year growth in debt of -32.84%, AUDIOCODES LTD's debt growth rate surpasses just 10.08% of about US stocks.
- The volatility of AUDIOCODES LTD's share price is greater than that of 85.1% US stocks with at least 200 days of trading history.
- If you're looking for stocks that are quantitatively similar to AUDIOCODES LTD, a group of peers worth examining would be NSPR, SCKT, CMBM, DAIO, and WISA.
- Visit AUDC's SEC page to see the company's official filings. To visit the company's web site, go to www.audiocodes.com.
AUDC Valuation Summary
- AUDC's price/sales ratio is 1.2; this is 57.14% lower than that of the median Technology stock.
- AUDC's price/sales ratio has moved down 6.4 over the prior 243 months.
Below are key valuation metrics over time for AUDC.
Stock | Date | P/S | P/B | P/E | EV/EBIT |
---|---|---|---|---|---|
AUDC | 2023-07-24 | 1.2 | 1.7 | 15.8 | 13.1 |
AUDC | 2023-07-21 | 1.2 | 1.7 | 15.8 | 13.0 |
AUDC | 2023-07-20 | 1.2 | 1.7 | 16.0 | 13.2 |
AUDC | 2023-07-19 | 1.2 | 1.8 | 16.7 | 13.8 |
AUDC | 2023-07-18 | 1.2 | 1.7 | 16.5 | 13.6 |
AUDC | 2023-07-17 | 1.2 | 1.7 | 16.3 | 13.4 |
AUDC Growth Metrics
- Its 5 year net cashflow from operations growth rate is now at 31.43%.
- The 2 year cash and equivalents growth rate now stands at -43.63%.
- Its 3 year revenue growth rate is now at 42.17%.

The table below shows AUDC's growth in key financial areas (numbers in millions of US dollars).
Date | Revenue | Operating Cash Flow | Net Income to Common Stock |
---|---|---|---|
2022-12-31 | 275.093 | 8.281 | 28.466 |
2022-09-30 | 270.536 | 12.111 | 28.172 |
2022-06-30 | 264.224 | 23.022 | 31.062 |
2022-03-31 | 256.439 | 35.262 | 32.366 |
2021-12-31 | 248.92 | 47.344 | 33.751 |
2021-12-31 | 248.92 | 47.344 | 33.751 |
AUDC's Quality Factors
The “Quality” component of the POWR Ratings focuses on 31 different factors of a companies fundamentals and operational strength. Here are some key insights as we drill into the specifics of these quality attributes.- AUDC has a Quality Grade of A, ranking ahead of 97.62% of graded US stocks.
- AUDC's asset turnover comes in at 0.733 -- ranking 98th of 208 Electronic Equipment stocks.
- 500 - Internal server error
The table below shows AUDC's key quality metrics over time.
Period | Asset Turnover | Gross Margin | ROIC |
---|---|---|---|
2020-12-31 | 0.733 | 0.679 | 0.254 |
2019-12-31 | 0.945 | 0.474 | -0.125 |
2018-12-31 | 1.006 | 0.628 | 0.245 |
2017-12-31 | 0.876 | 0.624 | 0.119 |
2016-12-31 | 0.773 | 0.607 | 0.082 |
2015-12-31 | 0.716 | 0.592 | 0.025 |
AUDC Price Target
For more insight on analysts targets of AUDC, see our AUDC price target page. And for a list of of all stocks sorted by upside potential based on analyst target price, see our Top Price Target page.
Average Price Target | $40.50 | Average Broker Recommendation | 1.4 (Strong Buy) |
AudioCodes Ltd. (AUDC) Company Bio
AudioCodes Ltd. designs, develops, and sells voice over IP, (VoIP), converged VoIP, and data networking products and applications to service providers and enterprises worldwide. The company was founded in 1992 and is based in Lod, Israel.
Latest AUDC News From Around the Web
Below are the latest news stories about AUDIOCODES LTD that investors may wish to consider to help them evaluate AUDC as an investment opportunity.
Ticking Time Bombs: 3 Nasdaq Stocks to Dump Before the Damage Is DoneWhile it’s an icky and perhaps controversial topic, outside market forecast necessitate a discussion about Nasdaq stocks to sell. |
Sidoti Events, LLC’s Virtual September Small-Cap ConferenceSidoti Events, LLC, an affiliate of Sidoti & Company, LLC, has released the presentation schedule and weblinks for its two-day September Small-Cap Conference taking place Wednesday and Thursday, September 20-21, 2023. The presentation schedule is subject to change. |
Will Qualcomm (QCOM) Gain From Manchester United Sponsorship?The three-year agreement with Manchester United is likely to prove beneficial for Qualcomm (QCOM) with top-of-the-mind recall and amplified brand presence. |
Qualcomm (QCOM) Down on China Woes: Should Investors Worry?Qualcomm (QCOM) is increasingly focusing on the seamless transition to a connected processor company for the intelligent edge with a diversified revenue stream. |
AUDC or ANET: Which Is the Better Value Stock Right Now?AUDC vs. ANET: Which Stock Is the Better Value Option? |
AUDC Price Returns
1-mo | N/A |
3-mo | 8.54% |
6-mo | N/A |
1-year | -54.25% |
3-year | -66.13% |
5-year | 11.98% |
YTD | -42.43% |
2022 | -47.75% |
2021 | 27.45% |
2020 | 8.23% |
2019 | 163.91% |
2018 | 37.00% |
AUDC Dividends
Ex-Dividend Date | Type | Payout Amount | Change | ||||||
---|---|---|---|---|---|---|---|---|---|
Loading, please wait... |
Continue Researching AUDC
Want to see what other sources are saying about Audiocodes Ltd's financials and stock price? Try the links below:Audiocodes Ltd (AUDC) Stock Price | Nasdaq
Audiocodes Ltd (AUDC) Stock Quote, History and News - Yahoo Finance
Audiocodes Ltd (AUDC) Stock Price and Basic Information | MarketWatch
Loading social stream, please wait...