Armstrong World Industries Inc (AWI): Price and Financial Metrics
AWI Stock Summary
- Of note is the ratio of Armstrong World Industries Inc's sales and general administrative expense to its total operating expenses; 99.17% of US stocks have a lower such ratio.
- Over the past twelve months, AWI has reported earnings growth of -137.94%, putting it ahead of merely 14.4% of US stocks in our set.
- In terms of volatility of its share price, AWI is more volatile than merely 12.75% of stocks we're observing.
- Stocks with similar financial metrics, market capitalization, and price volatility to Armstrong World Industries Inc are FDP, GBX, ELTK, BG, and ORN.
- AWI's SEC filings can be seen here. And to visit Armstrong World Industries Inc's official web site, go to www.armstrongceilings.com.
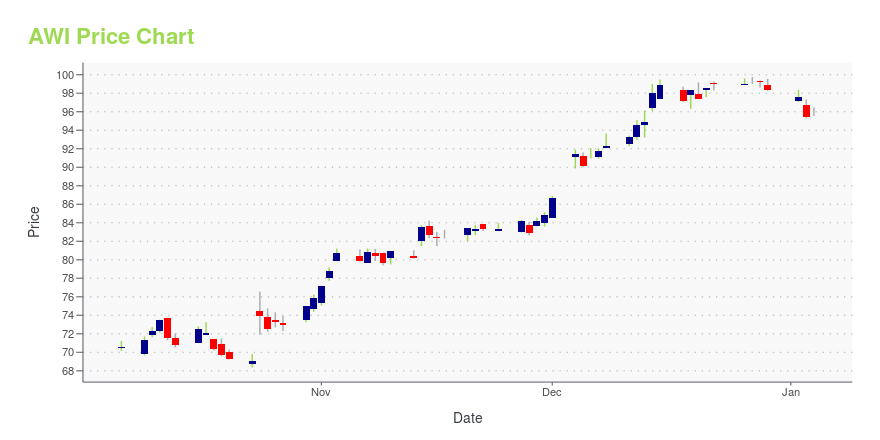
AWI Stock Price Chart Interactive Chart >
AWI Price/Volume Stats
Current price | $86.06 | 52-week high | $106.68 |
Prev. close | $85.16 | 52-week low | $57.96 |
Day low | $83.37 | Volume | 420,600 |
Day high | $86.55 | Avg. volume | 400,328 |
50-day MA | $80.60 | Dividend yield | 0.98% |
200-day MA | $75.18 | Market Cap | 4.11B |
Armstrong World Industries Inc (AWI) Company Bio
Armstrong World Industries designs, manufactures, and sells flooring products and ceiling systems worldwide. The company was founded in 1891 and is based in Lancaster, Pennsylvania.
AWI Price Forecast Based on DCF Valuation
Current Price | DCF Fair Value Target: | Forecasted Gain: |
$86.06 | $265.66 | 212% |
We started the process of determining a valid price forecast for Armstrong World Industries Inc with a discounted cash flow analysis -- the results of which can be found in the table below. To summarize, we found that Armstrong World Industries Inc ranked in the 75th percentile in terms of potential gain offered. Moreover, under all the scenarios we modelled, the output consistently forecasted positive returns. The most interesting components of our discounted cash flow analysis for Armstrong World Industries Inc ended up being:
- In the past 5.82 years, Armstrong World Industries Inc has a compound free cash flow growth rate of 0.67%; that's better than 87.66% of cash flow producing equities in the Basic Materials sector, where it is classified.
- Armstrong World Industries Inc's effective tax rate, as measured by taxes paid relative to net income, is at 27 -- greater than 88.17% of US stocks with positive free cash flow.
- Armstrong World Industries Inc's interest coverage rate -- a measure of gross earnings relative to interest payments -- comes in at -4.88. This coverage rate is greater than that of merely 12.06% of stocks we're observing for the purpose of forecasting via discounted cash flows.
Terminal Growth Rate in Free Cash Flow | Return Relative to Current Share Price |
0% | 206% |
1% | 209% |
2% | 212% |
3% | 215% |
4% | 218% |
5% | 221% |
CNR, BCC, SBSW, JELD, and KRA can be thought of as valuation peers to AWI, in the sense that they are in the Basic Materials sector and have a similar price forecast based on DCF valuation.
Latest AWI News From Around the Web
Below are the latest news stories about Armstrong World Industries Inc that investors may wish to consider to help them evaluate AWI as an investment opportunity.
10 Best Manufacturing Stocks To Buy NowIn this article we will take a look at the best manufacturing stocks to buy now. You can skip our detailed analysis of the manufacturing industry’s outlook for 2021 and some of the major growth catalysts for manufacturing stocks and go directly to 5 Best Manufacturing Stocks To Buy Now. Manufacturing stocks languished throughout 2020, […] |
Understanding Armstrong World Indus's Ex-Dividend DateOn February 17, 2021, Armstrong World Indus (NYSE:AWI) declared a dividend payable on March 18, 2021 to its shareholders. Armstrong World Indus also announced that shareholders on the company's books on or before March 4, 2021 are entitled to the dividend. The stock will then go ex-dividend 1 business day(s) before the record date. Armstrong World Indus, whose current dividend payout is $0.21, has an ex-dividend date set at March 3, 2021. The payout equates to a dividend yield of 1.02% at current price levels. The Significance Of An Ex-Dividend Date Ex-dividend dates signal when company shares cease to trade with their current dividend payouts. There is a small intermission period before companies announce new dividends. Usually, a company's ex-dividend date falls one business day befor... |
Armstrong World Industries, Inc. 2020 Q4 - Results - Earnings Call PresentationThe following slide deck was published by Armstrong World Industries, Inc. in conjunction with their 2020 Q4 earnings call.... |
Armstrong World: Debt OverviewOver the past three months, shares of Armstrong World Indus (NYSE:AWI) increased by 9.91%. Before we understand the importance of debt, let us look at how much debt Armstrong World Indus has. Armstrong World Indus's Debt Based on Armstrong World Indus's balance sheet as of February 23, 2021, long-term debt is at $709.30 million and current debt is at $27.00 million, amounting to $736.30 million in total debt. Adjusted for $136.90 million in cash-equivalents, the company's net debt is at $599.40 million. Let's define some of the terms we used in the paragraph above. Current debt is the portion of a company's debt which is due within 1 year, while long-term debt is the portion due in more than 1 year. Cash equivalents include cash and any liquid securities with maturity periods of 90 days... |
Armstrong World Industries, Inc. (AWI) CEO Vic Grizzle on Q4 2020 Results - Earnings Call TranscriptArmstrong World Industries, Inc. (AWI) Q4 2020 Results Conference Call February 23, 2021 11:00 PM ET Company Participants Tom Waters - IR Vic Grizzle - CEO Brian MacNeal - CFO Conference Call Participants Kathryn Thompson - Thompson Research John Lovallo - BofA Adam Baumgarten - Crédit Suisse Susan Maklari -... |
AWI Price Returns
1-mo | 5.75% |
3-mo | 6.84% |
6-mo | 22.45% |
1-year | -17.26% |
3-year | 48.95% |
5-year | 112.17% |
YTD | 15.98% |
2020 | -19.97% |
2019 | 62.79% |
2018 | -3.61% |
2017 | 44.86% |
2016 | -8.59% |
AWI Dividends
Ex-Dividend Date | Type | Payout Amount | Change | ||||||
---|---|---|---|---|---|---|---|---|---|
Loading, please wait... |
Continue Researching AWI
Want to do more research on Armstrong World Industries Inc's stock and its price? Try the links below:Armstrong World Industries Inc (AWI) Stock Price | Nasdaq
Armstrong World Industries Inc (AWI) Stock Quote, History and News - Yahoo Finance
Armstrong World Industries Inc (AWI) Stock Price and Basic Information | MarketWatch
Get Free Updates
Join thousands of investors who get the latest news, insights and top rated picks from StockNews.com!
Loading social stream, please wait...