Axis Capital Holdings Limited (AXS): Price and Financial Metrics
AXS Price/Volume Stats
Current price | $65.02 | 52-week high | $65.32 |
Prev. close | $64.99 | 52-week low | $51.61 |
Day low | $64.76 | Volume | 811,582 |
Day high | $65.32 | Avg. volume | 631,311 |
50-day MA | $60.82 | Dividend yield | 2.76% |
200-day MA | $56.67 | Market Cap | 5.49B |
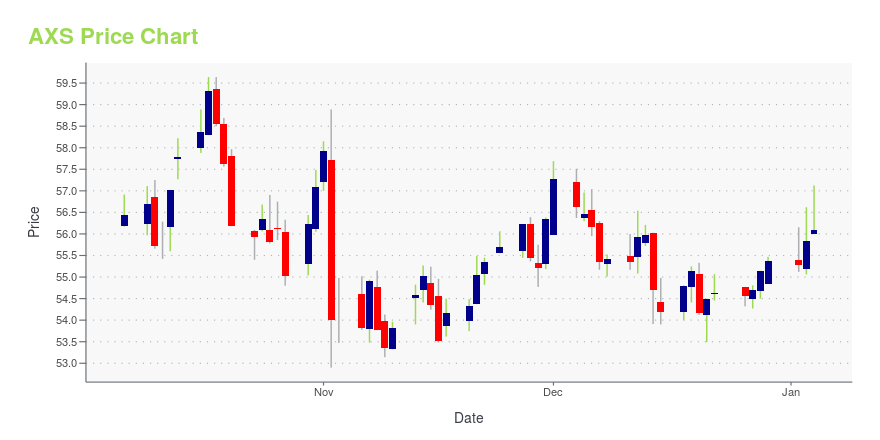
AXS Stock Price Chart Interactive Chart >
AXS POWR Grades
- AXS scores best on the Growth dimension, with a Growth rank ahead of 94.93% of US stocks.
- AXS's strongest trending metric is Growth; it's been moving down over the last 26 weeks.
- AXS ranks lowest in Quality; there it ranks in the 37th percentile.
AXS Stock Summary
- With a price/earnings ratio of 8.86, AXIS CAPITAL HOLDINGS LTD P/E ratio is greater than that of about only 18.31% of stocks in our set with positive earnings.
- In terms of twelve month growth in earnings before interest and taxes, AXIS CAPITAL HOLDINGS LTD is reporting a growth rate of 62.42%; that's higher than 84.78% of US stocks.
- In terms of volatility of its share price, AXS is more volatile than merely 0.17% of stocks we're observing.
- Stocks with similar financial metrics, market capitalization, and price volatility to AXIS CAPITAL HOLDINGS LTD are RM, OUT, AFG, SSP, and AR.
- AXS's SEC filings can be seen here. And to visit AXIS CAPITAL HOLDINGS LTD's official web site, go to www.axiscapital.com.
AXS Valuation Summary
- AXS's price/sales ratio is 0.8; this is 70.37% lower than that of the median Financial Services stock.
- Over the past 243 months, AXS's price/sales ratio has gone down 6.3.
Below are key valuation metrics over time for AXS.
Stock | Date | P/S | P/B | P/E | EV/EBIT |
---|---|---|---|---|---|
AXS | 2023-12-22 | 0.8 | 0.9 | 8.7 | 6.7 |
AXS | 2023-12-21 | 0.8 | 0.9 | 8.6 | 6.7 |
AXS | 2023-12-20 | 0.8 | 0.9 | 8.6 | 6.7 |
AXS | 2023-12-19 | 0.8 | 0.9 | 8.8 | 6.8 |
AXS | 2023-12-18 | 0.8 | 0.9 | 8.7 | 6.7 |
AXS | 2023-12-15 | 0.8 | 0.9 | 8.6 | 6.7 |
AXS Growth Metrics
- The 4 year cash and equivalents growth rate now stands at -14.5%.
- The 5 year cash and equivalents growth rate now stands at -14.5%.
- Its 3 year price growth rate is now at 0.37%.
The table below shows AXS's growth in key financial areas (numbers in millions of US dollars).
Date | Revenue | Operating Cash Flow | Net Income to Common Stock |
---|---|---|---|
2022-12-31 | 5,135.439 | 692.216 | 192.833 |
2022-09-30 | 5,081.01 | 1,021.668 | 349.236 |
2022-06-30 | 5,190.696 | 1,093.661 | 413.568 |
2022-03-31 | 5,333.203 | 1,102.987 | 614.263 |
2021-12-31 | 5,321.725 | 1,114.822 | 588.359 |
2021-09-30 | 5,205.807 | 1,004.888 | 386.213 |
AXS's Quality Factors
The “Quality” component of the POWR Ratings focuses on 31 different factors of a companies fundamentals and operational strength. Here are some key insights as we drill into the specifics of these quality attributes.- AXS has a Quality Grade of C, ranking ahead of 33.57% of graded US stocks.
- AXS's asset turnover comes in at 0.192 -- ranking 83rd of 133 Insurance stocks.
- JRVR, RGA, and AON are the stocks whose asset turnover ratios are most correlated with AXS.
The table below shows AXS's key quality metrics over time.
Period | Asset Turnover | Gross Margin | ROIC |
---|---|---|---|
2021-09-30 | 0.192 | 0.403 | 0.020 |
2021-06-30 | 0.191 | 0.399 | 0.015 |
2021-03-31 | 0.188 | 0.380 | 0.010 |
2020-12-31 | 0.185 | 0.322 | -0.002 |
2020-09-30 | 0.188 | 0.322 | -0.002 |
2020-06-30 | 0.191 | 0.334 | 0.003 |
AXS Price Target
For more insight on analysts targets of AXS, see our AXS price target page. And for a list of of all stocks sorted by upside potential based on analyst target price, see our Top Price Target page.
Average Price Target | $56.67 | Average Broker Recommendation | 1.94 (Hold) |
Axis Capital Holdings Limited (AXS) Company Bio
Axis Capital Holdings Limited provides insurance and treaty reinsurance products Worldwide. The company operates through Insurance and Reinsurance segments. The company was founded in 2001 and is based in Pembroke, Bermuda.
Latest AXS News From Around the Web
Below are the latest news stories about AXIS CAPITAL HOLDINGS LTD that investors may wish to consider to help them evaluate AXS as an investment opportunity.
3 Dividend Stocks To Maximize Your Retirement IncomeIn this article, we shall take a look at three dividend-paying stocks retirees should consider for their nest egg portfolio |
AXIS Capital Holdings (NYSE:AXS) Has Announced A Dividend Of $0.44AXIS Capital Holdings Limited ( NYSE:AXS ) will pay a dividend of $0.44 on the 18th of January. The dividend yield will... |
AXIS Capital Holdings (NYSE:AXS) Could Be A Buy For Its Upcoming DividendSome investors rely on dividends for growing their wealth, and if you're one of those dividend sleuths, you might be... |
AXIS Capital to Release Fourth Quarter Financial Results on January 31, 2024PEMBROKE, Bermuda, December 22, 2023--AXIS Capital Holdings Limited ("AXIS Capital" or the "Company") (NYSE: AXS) today announced that it expects to release financial results for the fourth quarter ended December 31, 2023 on Wednesday, January 31, 2024 after the close of the financial markets. |
Why You Should Stay Invested in Axis Capital (AXS) StockAXIS Capital (AXS) stands to gain from higher net investment income, strong market presence, better pricing, solid balance sheet and effective capital deployment. |
AXS Price Returns
1-mo | 4.94% |
3-mo | 18.26% |
6-mo | 17.10% |
1-year | 24.27% |
3-year | 41.19% |
5-year | 39.64% |
YTD | 18.26% |
2023 | 5.57% |
2022 | 2.63% |
2021 | 11.79% |
2020 | -11.92% |
2019 | 18.26% |
AXS Dividends
Ex-Dividend Date | Type | Payout Amount | Change | ||||||
---|---|---|---|---|---|---|---|---|---|
Loading, please wait... |
Continue Researching AXS
Want to do more research on Axis Capital Holdings Ltd's stock and its price? Try the links below:Axis Capital Holdings Ltd (AXS) Stock Price | Nasdaq
Axis Capital Holdings Ltd (AXS) Stock Quote, History and News - Yahoo Finance
Axis Capital Holdings Ltd (AXS) Stock Price and Basic Information | MarketWatch
Loading social stream, please wait...