Axis Capital Holdings Limited (AXS): Price and Financial Metrics
GET POWR RATINGS... FREE!
AXS POWR Grades
- Momentum is the dimension where AXS ranks best; there it ranks ahead of 83% of US stocks.
- AXS's strongest trending metric is Growth; it's been moving down over the last 177 days.
- AXS's current lowest rank is in the Growth metric (where it is better than 13.61% of US stocks).
AXS Stock Summary
- Of note is the ratio of AXIS CAPITAL HOLDINGS LTD's sales and general administrative expense to its total operating expenses; merely 19.32% of US stocks have a lower such ratio.
- AXS's equity multiplier -- a measure of assets relative to shareholders'equity -- is greater than that of 82.86% of US stocks.
- The volatility of AXIS CAPITAL HOLDINGS LTD's share price is greater than that of just 3.94% US stocks with at least 200 days of trading history.
- Stocks with similar financial metrics, market capitalization, and price volatility to AXIS CAPITAL HOLDINGS LTD are LOCO, CVEO, USNA, LGF.B, and IDEX.
- Visit AXS's SEC page to see the company's official filings. To visit the company's web site, go to www.axiscapital.com.
AXS Valuation Summary
- In comparison to the median Financial Services stock, AXS's price/sales ratio is 65.52% lower, now standing at 1.
- AXS's price/sales ratio has moved down 5.1 over the prior 238 months.
Below are key valuation metrics over time for AXS.
Stock | Date | P/S | P/B | P/E | EV/EBIT |
---|---|---|---|---|---|
AXS | 2023-01-23 | 1.0 | 1.1 | 14.0 | 10.1 |
AXS | 2023-01-20 | 1.0 | 1.1 | 13.8 | 10.0 |
AXS | 2023-01-19 | 0.9 | 1.1 | 13.7 | 9.9 |
AXS | 2023-01-18 | 0.9 | 1.1 | 13.7 | 9.9 |
AXS | 2023-01-17 | 0.9 | 1.1 | 13.7 | 9.9 |
AXS | 2023-01-13 | 0.9 | 1.1 | 13.8 | 10.0 |
AXS Growth Metrics
- Its 4 year cash and equivalents growth rate is now at -14.5%.
- The 4 year net income to common stockholders growth rate now stands at -100.27%.
- The 2 year cash and equivalents growth rate now stands at 37.52%.

The table below shows AXS's growth in key financial areas (numbers in millions of US dollars).
Date | Revenue | Operating Cash Flow | Net Income to Common Stock |
---|---|---|---|
2022-09-30 | 5,081.01 | 1,021.668 | 349.236 |
2022-06-30 | 5,190.696 | 1,093.661 | 413.568 |
2022-03-31 | 5,333.203 | 1,102.987 | 614.263 |
2021-12-31 | 5,321.725 | 1,114.822 | 588.359 |
2021-09-30 | 5,205.807 | 1,004.888 | 386.213 |
2021-06-30 | 5,118.761 | 772.438 | 265.883 |
AXS's Quality Factors
The “Quality” component of the POWR Ratings focuses on 31 different factors of a companies fundamentals and operational strength. Here are some key insights as we drill into the specifics of these quality attributes.- AXS has a Quality Grade of C, ranking ahead of 33.57% of graded US stocks.
- AXS's asset turnover comes in at 0.192 -- ranking 83rd of 133 Insurance stocks.
- JRVR, RGA, and AON are the stocks whose asset turnover ratios are most correlated with AXS.
The table below shows AXS's key quality metrics over time.
Period | Asset Turnover | Gross Margin | ROIC |
---|---|---|---|
2021-09-30 | 0.192 | 0.403 | 0.020 |
2021-06-30 | 0.191 | 0.399 | 0.015 |
2021-03-31 | 0.188 | 0.380 | 0.010 |
2020-12-31 | 0.185 | 0.322 | -0.002 |
2020-09-30 | 0.188 | 0.322 | -0.002 |
2020-06-30 | 0.191 | 0.334 | 0.003 |
AXS Price Target
For more insight on analysts targets of AXS, see our AXS price target page. And for a list of of all stocks sorted by upside potential based on analyst target price, see our Top Price Target page.
Average Price Target | $56.67 | Average Broker Recommendation | 1.94 (Hold) |
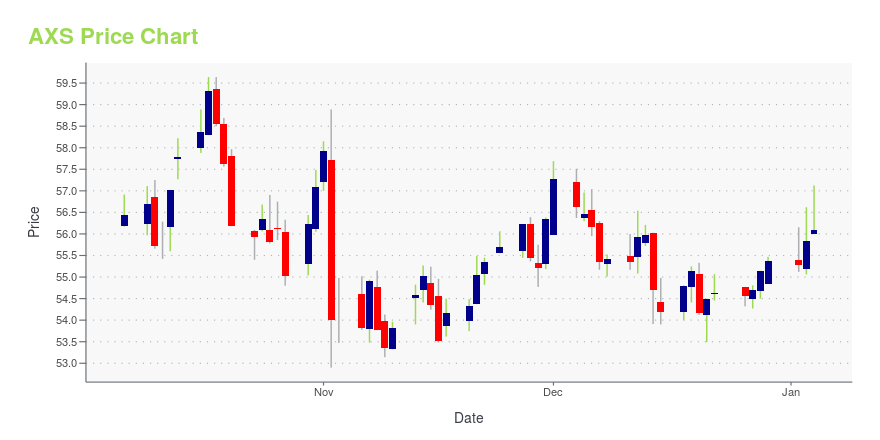
AXS Stock Price Chart Interactive Chart >
AXS Price/Volume Stats
Current price | $61.55 | 52-week high | $63.99 |
Prev. close | $62.43 | 52-week low | $48.32 |
Day low | $61.47 | Volume | 257,188 |
Day high | $62.60 | Avg. volume | 479,751 |
50-day MA | $56.49 | Dividend yield | 2.82% |
200-day MA | $54.77 | Market Cap | 5.21B |
Axis Capital Holdings Limited (AXS) Company Bio
Axis Capital Holdings Limited provides insurance and treaty reinsurance products Worldwide. The company operates through Insurance and Reinsurance segments. The company was founded in 2001 and is based in Pembroke, Bermuda.
Latest AXS News From Around the Web
Below are the latest news stories about AXIS CAPITAL HOLDINGS LTD that investors may wish to consider to help them evaluate AXS as an investment opportunity.
AXIS Capital Reports Fourth Quarter Net Income Available to Common Shareholders of $41 Million, or $0.48 Per Diluted Common Share and Operating Income of $167 Million, or $1.95 Per Diluted Common SharePEMBROKE, Bermuda, January 25, 2023--AXIS Capital Holdings Limited ("AXIS Capital" or "AXIS" or "the Company") (NYSE: AXS) today announced financial results for the fourth quarter ended December 31, 2022. |
Earnings Preview: Axis Capital (AXS) Q4 Earnings Expected to DeclineAxis Capital (AXS) doesn't possess the right combination of the two key ingredients for a likely earnings beat in its upcoming report. Get prepared with the key expectations. |
Are You a Value Investor? This 1 Stock Could Be the Perfect PickThe Zacks Style Scores offers investors a way to easily find top-rated stocks based on their investing style. Here's why you should take advantage. |
AXIS CEO Albert A. Benchimol to Retire; Vincent C. Tizzio Named Future CEOPEMBROKE, Bermuda, December 20, 2022--AXIS Capital Holdings Limited ("AXIS" or the "Company") (NYSE: AXS) announced today that, following a career in (re)insurance and banking that has spanned more than four decades – including ten years as President and CEO of AXIS – Albert A. Benchimol will step down from his role on May 4, 2023, timed to the Company’s Annual General Meeting (AGM), and will retire at the end of 2023. He will be succeeded as President and CEO by Vincent C. Tizzio, who currently |
Should You Retain Axis Capital (AXS) Stock in Your Portfolio?Increases in lines of business, new business growth, continued strong retentions, accelerated digitalization and prudent capital deployment continue to drive AXIS Capital (AXS). |
AXS Price Returns
1-mo | 13.62% |
3-mo | 14.67% |
6-mo | 24.73% |
1-year | 11.60% |
3-year | 6.23% |
5-year | 42.83% |
YTD | 13.62% |
2022 | 2.63% |
2021 | 11.79% |
2020 | -11.92% |
2019 | 18.26% |
2018 | 5.75% |
AXS Dividends
Ex-Dividend Date | Type | Payout Amount | Change | ||||||
---|---|---|---|---|---|---|---|---|---|
Loading, please wait... |
Continue Researching AXS
Want to do more research on Axis Capital Holdings Ltd's stock and its price? Try the links below:Axis Capital Holdings Ltd (AXS) Stock Price | Nasdaq
Axis Capital Holdings Ltd (AXS) Stock Quote, History and News - Yahoo Finance
Axis Capital Holdings Ltd (AXS) Stock Price and Basic Information | MarketWatch
Loading social stream, please wait...