Atlantica Yield plc - Ordinary Shares (AY): Price and Financial Metrics
AY Price/Volume Stats
Current price | $24.66 | 52-week high | $36.35 |
Prev. close | $24.72 | 52-week low | $23.73 |
Day low | $24.57 | Volume | 292,000 |
Day high | $24.94 | Avg. volume | 676,276 |
50-day MA | $26.61 | Dividend yield | 7.3% |
200-day MA | $27.66 | Market Cap | 2.77B |
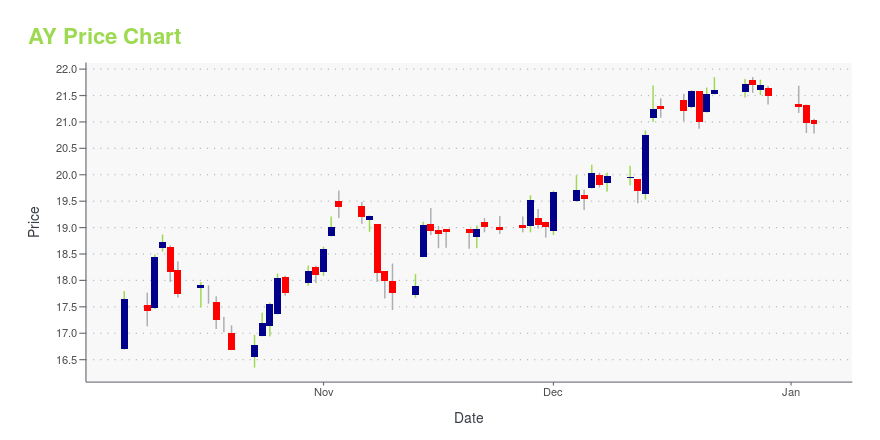
AY Stock Price Chart Interactive Chart >
AY POWR Grades
- Growth is the dimension where AY ranks best; there it ranks ahead of 73.55% of US stocks.
- The strongest trend for AY is in Stability, which has been heading down over the past 179 days.
- AY ranks lowest in Value; there it ranks in the 23rd percentile.
AY Stock Summary
- With a one year PEG ratio of 7,502.03, ATLANTICA SUSTAINABLE INFRASTRUCTURE PLC is expected to have a higher PEG ratio (a measure of how expensive a stock is relative to its expected earnings growth) than 99.69% of US stocks.
- For AY, its debt to operating expenses ratio is greater than that reported by 88.47% of US equities we're observing.
- As for revenue growth, note that AY's revenue has grown -10.37% over the past 12 months; that beats the revenue growth of only 16.85% of US companies in our set.
- Stocks with similar financial metrics, market capitalization, and price volatility to ATLANTICA SUSTAINABLE INFRASTRUCTURE PLC are GTLS, XEL, NDSN, ICFI, and ITT.
- AY's SEC filings can be seen here. And to visit ATLANTICA SUSTAINABLE INFRASTRUCTURE PLC's official web site, go to www.atlanticayield.com.
AY Valuation Summary
- In comparison to the median Utilities stock, AY's price/sales ratio is 83.78% higher, now standing at 3.4.
- AY's EV/EBIT ratio has moved down 24.7 over the prior 109 months.
Below are key valuation metrics over time for AY.
Stock | Date | P/S | P/B | P/E | EV/EBIT |
---|---|---|---|---|---|
AY | 2023-05-17 | 3.4 | 2.5 | -853.7 | 28.0 |
AY | 2023-05-16 | 3.4 | 2.5 | -857.1 | 28.1 |
AY | 2023-05-15 | 3.5 | 2.5 | -871.3 | 28.3 |
AY | 2023-05-12 | 3.5 | 2.5 | -875.9 | 28.3 |
AY | 2023-05-11 | 3.5 | 2.5 | -872.9 | 28.3 |
AY | 2023-05-10 | 3.5 | 2.5 | -863.4 | 28.1 |
AY Growth Metrics
- Its 5 year net income to common stockholders growth rate is now at 244.79%.
- Its year over year net income to common stockholders growth rate is now at -168.9%.
- Its 5 year net cashflow from operations growth rate is now at 4.78%.

The table below shows AY's growth in key financial areas (numbers in millions of US dollars).
Date | Revenue | Operating Cash Flow | Net Income to Common Stock |
---|---|---|---|
2022-09-30 | 1,129.736 | 579.409 | -21.387 |
2022-06-30 | 1,155.858 | 523.441 | -19.181 |
2022-03-31 | 1,224.011 | 496.229 | -22.95 |
2021-12-31 | 1,211.749 | 505.623 | -30.08 |
2021-09-30 | 1,184.944 | 576.917 | -67.407 |
2021-06-30 | 1,158.688 | 536.13 | 33.31 |
AY's Quality Factors
The “Quality” component of the POWR Ratings focuses on 31 different factors of a companies fundamentals and operational strength. Here are some key insights as we drill into the specifics of these quality attributes.- AY has a Quality Grade of C, ranking ahead of 56.9% of graded US stocks.
- AY's asset turnover comes in at 0.116 -- ranking 94th of 105 Utilities stocks.
- CQP, LNG, and WMB are the stocks whose asset turnover ratios are most correlated with AY.
The table below shows AY's key quality metrics over time.
Period | Asset Turnover | Gross Margin | ROIC |
---|---|---|---|
2021-06-30 | 0.116 | 0.940 | 0.030 |
2021-03-31 | 0.105 | 0.945 | 0.031 |
2020-12-31 | 0.104 | 0.946 | 0.029 |
2020-09-30 | 0.101 | 0.958 | 0.033 |
2020-06-30 | 0.101 | 0.959 | 0.032 |
2020-03-31 | 0.103 | 0.964 | 0.032 |
AY Price Target
For more insight on analysts targets of AY, see our AY price target page. And for a list of of all stocks sorted by upside potential based on analyst target price, see our Top Price Target page.
Average Price Target | $42.43 | Average Broker Recommendation | 1.78 (Moderate Buy) |
Atlantica Yield plc - Ordinary Shares (AY) Company Bio
Atlantica Yield plc owns a diversified portfolio of contracted renewable energy, power generation, electric transmission and water assets in North America, South America and certain markets in EMEA. The company was founded in 2013 and is based in Brentford, United Kingdom.
Latest AY News From Around the Web
Below are the latest news stories about ATLANTICA SUSTAINABLE INFRASTRUCTURE PLC that investors may wish to consider to help them evaluate AY as an investment opportunity.
Atlantica Sustainable Infrastructure (NASDAQ:AY) shareholders have earned a 12% CAGR over the last five yearsWhen you buy and hold a stock for the long term, you definitely want it to provide a positive return. Furthermore... |
Atlantica Sustainable Infrastructure plc (NASDAQ:AY) Q1 2023 Earnings Call TranscriptAtlantica Sustainable Infrastructure plc (NASDAQ:AY) Q1 2023 Earnings Call Transcript May 5, 2023 Santiago Seage: Thank you very much. Good morning, and thank you for joining for our First Quarter 2023 Conference Call. I will start with a couple of messages before Francisco takes us through our results. In the first quarter, revenue and adjusted […] |
Atlantica Sustainable Infrastructure (AY) Reports Q1 Loss, Misses Revenue EstimatesAtlantica Sustainable Infrastructure (AY) delivered earnings and revenue surprises of 47.06% and 4.06%, respectively, for the quarter ended March 2023. Do the numbers hold clues to what lies ahead for the stock? |
Dividend Champions, Contenders and Challengers List: 15 Highest Yielding StocksIn this article, we discuss 15 highest yielding dividend champions, contenders, and challengers. You can skip our detailed analysis of dividend stocks and their performance in the past, and go directly to read Dividend Champions, Contenders, and Challengers list: 5 Highest Yielding Stocks. Dividend Champions are companies that have histories of growing their dividends for […] |
Owning 46% shares,institutional owners seem interested in Atlantica Sustainable Infrastructure plc (NASDAQ:AY),Key Insights Institutions' substantial holdings in Atlantica Sustainable Infrastructure implies that they have... |
AY Price Returns
1-mo | -3.15% |
3-mo | -9.37% |
6-mo | -5.09% |
1-year | -23.56% |
3-year | 4.24% |
5-year | 66.92% |
YTD | -1.43% |
2022 | -23.47% |
2021 | -1.43% |
2020 | 52.41% |
2019 | 44.34% |
2018 | -1.12% |
AY Dividends
Ex-Dividend Date | Type | Payout Amount | Change | ||||||
---|---|---|---|---|---|---|---|---|---|
Loading, please wait... |
Continue Researching AY
Want to do more research on Atlantica Yield plc's stock and its price? Try the links below:Atlantica Yield plc (AY) Stock Price | Nasdaq
Atlantica Yield plc (AY) Stock Quote, History and News - Yahoo Finance
Atlantica Yield plc (AY) Stock Price and Basic Information | MarketWatch
Loading social stream, please wait...