Acuity Brands, Inc. (AYI): Price and Financial Metrics
AYI Price/Volume Stats
Current price | $164.67 | 52-week high | $202.90 |
Prev. close | $163.85 | 52-week low | $149.30 |
Day low | $163.97 | Volume | 275,000 |
Day high | $167.14 | Avg. volume | 321,319 |
50-day MA | $162.80 | Dividend yield | 0.31% |
200-day MA | $169.44 | Market Cap | 5.14B |
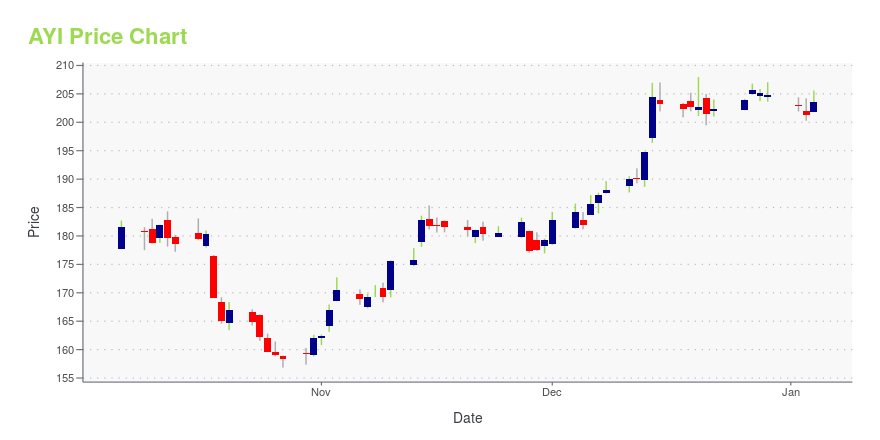
AYI Stock Price Chart Interactive Chart >
AYI POWR Grades
- AYI scores best on the Quality dimension, with a Quality rank ahead of 99.21% of US stocks.
- The strongest trend for AYI is in Growth, which has been heading down over the past 179 days.
- AYI ranks lowest in Momentum; there it ranks in the 18th percentile.
AYI Stock Summary
- With a one year PEG ratio of 357.42, ACUITY BRANDS INC is expected to have a higher PEG ratio (a measure of how expensive a stock is relative to its expected earnings growth) than 91.76% of US stocks.
- Of note is the ratio of ACUITY BRANDS INC's sales and general administrative expense to its total operating expenses; 85.6% of US stocks have a lower such ratio.
- Shareholder yield, a measure of how much is returned to shareholders via dividends and share repurchases, for AYI comes in at 8.94% -- higher than that of 80.99% of stocks in our set.
- If you're looking for stocks that are quantitatively similar to ACUITY BRANDS INC, a group of peers worth examining would be MYRG, MYE, JBSS, WTS, and DCI.
- Visit AYI's SEC page to see the company's official filings. To visit the company's web site, go to www.acuitybrands.com.
AYI Valuation Summary
- In comparison to the median Industrials stock, AYI's price/earnings ratio is 29.03% lower, now standing at 13.2.
- Over the past 243 months, AYI's EV/EBIT ratio has gone down 1.
Below are key valuation metrics over time for AYI.
Stock | Date | P/S | P/B | P/E | EV/EBIT |
---|---|---|---|---|---|
AYI | 2023-09-15 | 1.2 | 2.5 | 13.2 | 10.2 |
AYI | 2023-09-14 | 1.2 | 2.5 | 13.2 | 10.2 |
AYI | 2023-09-13 | 1.2 | 2.5 | 13.1 | 10.1 |
AYI | 2023-09-12 | 1.2 | 2.5 | 13.1 | 10.1 |
AYI | 2023-09-11 | 1.2 | 2.5 | 13.0 | 10.1 |
AYI | 2023-09-08 | 1.2 | 2.5 | 13.1 | 10.1 |
AYI Growth Metrics
- The year over year revenue growth rate now stands at 15.19%.
- Its year over year price growth rate is now at 3.1%.
- Its 3 year net cashflow from operations growth rate is now at -10.96%.

The table below shows AYI's growth in key financial areas (numbers in millions of US dollars).
Date | Revenue | Operating Cash Flow | Net Income to Common Stock |
---|---|---|---|
2022-12-31 | 4,077.9 | 419.2 | 371.3 |
2022-09-30 | 4,006.1 | 316.3 | 384 |
2022-06-30 | 3,888.5 | 258.2 | 366.7 |
2022-03-31 | 3,727.6 | 323.4 | 346.7 |
2021-12-31 | 3,595.1 | 368.5 | 334.3 |
2021-09-30 | 3,461 | 408.7 | 306.3 |
AYI's Quality Factors
The “Quality” component of the POWR Ratings focuses on 31 different factors of a companies fundamentals and operational strength. Here are some key insights as we drill into the specifics of these quality attributes.- AYI has a Quality Grade of A, ranking ahead of 98.26% of graded US stocks.
- AYI's asset turnover comes in at 0.997 -- ranking 10th of 53 Electrical Equipment stocks.
- AME, RRX, and BYRN are the stocks whose asset turnover ratios are most correlated with AYI.
The table below shows AYI's key quality metrics over time.
Period | Asset Turnover | Gross Margin | ROIC |
---|---|---|---|
2021-08-31 | 0.997 | 0.426 | 0.346 |
2021-05-31 | 0.974 | 0.426 | 0.334 |
2021-02-28 | 0.946 | 0.424 | 0.312 |
2020-11-30 | 0.957 | 0.420 | 0.304 |
2020-08-31 | 0.976 | 0.422 | 0.305 |
2020-05-31 | 1.013 | 0.422 | 0.333 |
AYI Price Target
For more insight on analysts targets of AYI, see our AYI price target page. And for a list of of all stocks sorted by upside potential based on analyst target price, see our Top Price Target page.
Average Price Target | $192.00 | Average Broker Recommendation | 1.59 (Moderate Buy) |
Acuity Brands, Inc. (AYI) Company Bio
Acuity Brands designs, produces, and distributes lighting solutions, components, and services for commercial, institutional, industrial, infrastructure, and residential applications in North America and internationally. The company was founded in 2001 and is founded in Atlanta, Georgia.
Latest AYI News From Around the Web
Below are the latest news stories about ACUITY BRANDS INC that investors may wish to consider to help them evaluate AYI as an investment opportunity.
Wall Street Analysts Just Trimmed Price Targets for These 10 StocksIn this article, we will discuss the 10 stocks whose price targets were recently trimmed by analysts. If you want to see more such stocks on the list, go directly to Analysts Just Trimmed Price Targets for These 5 Stocks. In the ever-fluctuating landscape of global financial markets, recent developments have brought both optimism and uncertainty […] |
Acuity Brands to Announce Fiscal 2023 Fourth-Quarter and Full-Year Results on October 4, 2023ATLANTA, Aug. 31, 2023 (GLOBE NEWSWIRE) -- Acuity Brands, Inc. (NYSE: AYI) (the “Company”) today announced that it is planning to release its fiscal 2023 fourth-quarter and full-year earnings results on Wednesday, October 4, 2023, at 6:00 a.m. (EST), followed by a conference call at 8:00 a.m. (EST). Neil Ashe, Chairman, President, and Chief Executive Officer of Acuity Brands will lead the call. The webcast, earnings release, and supplemental presentation can be accessed via the Investor Relation |
Here's Why Acuity Brands (AYI) is a Strong Value StockWondering how to pick strong, market-beating stocks for your investment portfolio? Look no further than the Zacks Style Scores. |
An Intrinsic Calculation For Acuity Brands, Inc. (NYSE:AYI) Suggests It's 21% UndervaluedKey Insights The projected fair value for Acuity Brands is US$200 based on 2 Stage Free Cash Flow to Equity Current... |
Incandescent Bulbs Now Banned: Is There An Investment Play?The global market for LED bulbs is expected to grow at a CAGR of 15% from 2022 to 2027. |
AYI Price Returns
1-mo | 3.48% |
3-mo | 2.82% |
6-mo | -4.50% |
1-year | 4.48% |
3-year | 69.58% |
5-year | 3.07% |
YTD | -0.34% |
2022 | -21.55% |
2021 | 75.42% |
2020 | -11.79% |
2019 | 20.54% |
2018 | -34.44% |
AYI Dividends
Ex-Dividend Date | Type | Payout Amount | Change | ||||||
---|---|---|---|---|---|---|---|---|---|
Loading, please wait... |
Continue Researching AYI
Want to see what other sources are saying about Acuity Brands Inc's financials and stock price? Try the links below:Acuity Brands Inc (AYI) Stock Price | Nasdaq
Acuity Brands Inc (AYI) Stock Quote, History and News - Yahoo Finance
Acuity Brands Inc (AYI) Stock Price and Basic Information | MarketWatch
Loading social stream, please wait...