
Alibaba Group Holding Ltd. ADR (BABA): Price and Financial Metrics
BABA Price/Volume Stats
| Current price | $76.53 | 52-week high | $102.50 |
| Prev. close | $75.40 | 52-week low | $66.63 |
| Day low | $74.55 | Volume | 10,884,500 |
| Day high | $76.77 | Avg. volume | 16,971,438 |
| 50-day MA | $77.62 | Dividend yield | 1.29% |
| 200-day MA | $76.27 | Market Cap | 194.19B |
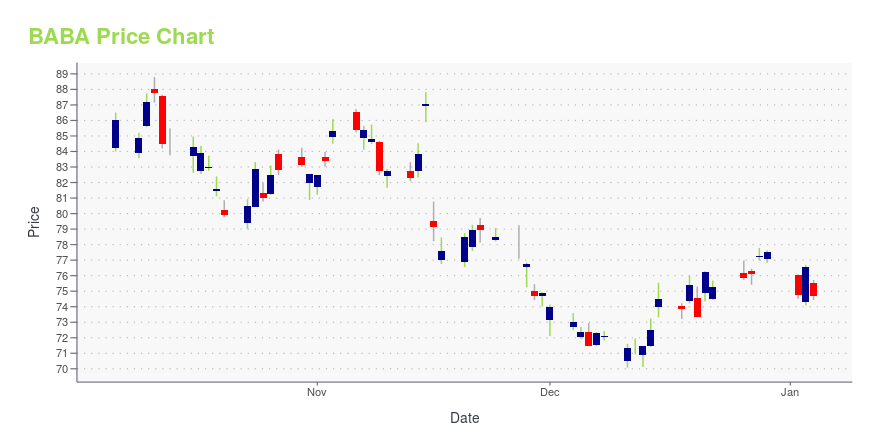
BABA Stock Price Chart Interactive Chart >
Alibaba Group Holding Ltd. ADR (BABA) Company Bio
Alibaba Group Holding Limited, also known as Alibaba (Chinese: 阿里巴巴), is a Chinese multinational technology company specializing in e-commerce, retail, Internet, and technology. Founded on 28 June 1999 in Hangzhou, Zhejiang, the company provides consumer-to-consumer (C2C), business-to-consumer (B2C), and business-to-business (B2B) sales services via web portals, as well as electronic payment services, shopping search engines, and cloud computing services. It owns and operates a diverse portfolio of companies around the world in numerous business sectors. (Source:Wikipedia)
Latest BABA News From Around the Web
Below are the latest news stories about ALIBABA GROUP HOLDING LTD that investors may wish to consider to help them evaluate BABA as an investment opportunity.
Alibaba Group Holding Limited (BABA) Is a Trending Stock: Facts to Know Before Betting on ItAlibaba (BABA) has received quite a bit of attention from Zacks.com users lately. Therefore, it is wise to be aware of the facts that can impact the stock's prospects. |
PDD Holdings Stock: Buy, Sell, or Hold?Let's review the Chinese e-commerce giant's core strengths and weaknesses. |
Alibaba Stock Rises Despite Lawsuit Threat, But Is BABA Stock A Buy Now?Alibaba stock rallied early Thursday despite news the company must face a lawsuit by Kelly Toys, a company connected with Warren Buffett. |
China's Alibaba must face a US toymaker's lawsuit over sales of allegedly fake SquishmallowsA judge in New York has ruled that Alibaba must face a lawsuit by a U.S. toymaker alleging that the Chinese ecommerce giant’s online platforms were used to sell counterfeit Squishmallows. Judge Jesse Furman of the Southern District Court of New York refused Alibaba’s request to dismiss the case filed by Kelly Toys Holdings, which makes the popular plush toys. Kelly Toys is owned by Jazwares, a toy company whose parent company Alleghany Corp. is controlled by billionaire Warren Buffett’s Berkshire Hathaway. |
Most Active Equity Options For Midday - Wednesday, Dec. 27Here are the most active equity options for midday. |
BABA Price Returns
| 1-mo | 3.18% |
| 3-mo | 3.47% |
| 6-mo | 5.62% |
| 1-year | -17.01% |
| 3-year | -57.43% |
| 5-year | -55.69% |
| YTD | 0.86% |
| 2023 | -10.85% |
| 2022 | -25.84% |
| 2021 | -48.96% |
| 2020 | 9.73% |
| 2019 | 54.74% |
BABA Dividends
| Ex-Dividend Date | Type | Payout Amount | Change | ||||||
|---|---|---|---|---|---|---|---|---|---|
| Loading, please wait... | |||||||||
Continue Researching BABA
Want to do more research on Alibaba Group Holding Ltd's stock and its price? Try the links below:Alibaba Group Holding Ltd (BABA) Stock Price | Nasdaq
Alibaba Group Holding Ltd (BABA) Stock Quote, History and News - Yahoo Finance
Alibaba Group Holding Ltd (BABA) Stock Price and Basic Information | MarketWatch
Loading social stream, please wait...