Becton Dickinson & Co. (BDX): Price and Financial Metrics
BDX Price/Volume Stats
Current price | $265.20 | 52-week high | $287.32 |
Prev. close | $265.04 | 52-week low | $215.90 |
Day low | $264.03 | Volume | 633,300 |
Day high | $266.82 | Avg. volume | 1,164,011 |
50-day MA | $272.72 | Dividend yield | 1.37% |
200-day MA | $255.76 | Market Cap | 76.94B |
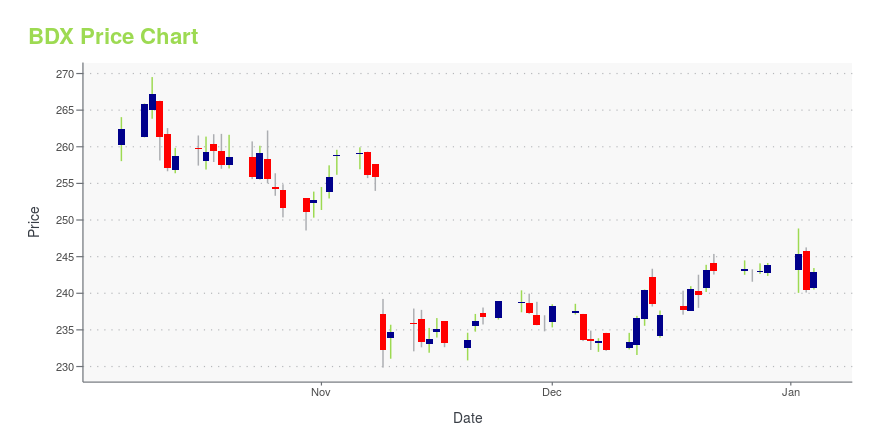
BDX Stock Price Chart Interactive Chart >
BDX POWR Grades
- Stability is the dimension where BDX ranks best; there it ranks ahead of 88.91% of US stocks.
- BDX's strongest trending metric is Growth; it's been moving up over the last 179 days.
- BDX ranks lowest in Momentum; there it ranks in the 21st percentile.
BDX Stock Summary
- With a market capitalization of $76,754,025,423, BECTON DICKINSON & CO has a greater market value than 97.09% of US stocks.
- BECTON DICKINSON & CO's stock had its IPO on January 1, 1986, making it an older stock than 93.16% of US equities in our set.
- In terms of volatility of its share price, BDX is more volatile than only 6.87% of stocks we're observing.
- Stocks with similar financial metrics, market capitalization, and price volatility to BECTON DICKINSON & CO are MDT, DELL, A, CARR, and CSGP.
- BDX's SEC filings can be seen here. And to visit BECTON DICKINSON & CO's official web site, go to www.bd.com.
BDX Valuation Summary
- BDX's EV/EBIT ratio is 41.2; this is 232.26% higher than that of the median Healthcare stock.
- Over the past 243 months, BDX's EV/EBIT ratio has gone up 26.9.
Below are key valuation metrics over time for BDX.
Stock | Date | P/S | P/B | P/E | EV/EBIT |
---|---|---|---|---|---|
BDX | 2023-09-18 | 4.0 | 3.0 | 48.5 | 41.2 |
BDX | 2023-09-15 | 4.0 | 2.9 | 48.4 | 41.1 |
BDX | 2023-09-14 | 4.0 | 3.0 | 48.6 | 41.2 |
BDX | 2023-09-13 | 4.0 | 3.0 | 48.6 | 41.3 |
BDX | 2023-09-12 | 4.0 | 2.9 | 48.4 | 41.1 |
BDX | 2023-09-11 | 4.1 | 3.0 | 49.0 | 41.6 |
BDX Growth Metrics
- Its 2 year price growth rate is now at 1.32%.
- Its 3 year net income to common stockholders growth rate is now at 97.41%.
- Its 4 year cash and equivalents growth rate is now at 345.07%.

The table below shows BDX's growth in key financial areas (numbers in millions of US dollars).
Date | Revenue | Operating Cash Flow | Net Income to Common Stock |
---|---|---|---|
2022-12-31 | 18,999 | 2,359 | 1,520 |
2022-09-30 | 18,870 | 2,634 | 1,689 |
2022-06-30 | 19,782 | 2,612 | 1,666 |
2022-03-31 | 20,031 | 3,044 | 1,830 |
2021-12-31 | 19,927 | 3,788 | 1,676 |
2021-09-30 | 20,248 | 4,647 | 2,002 |
BDX's Quality Factors
The “Quality” component of the POWR Ratings focuses on 31 different factors of a companies fundamentals and operational strength. Here are some key insights as we drill into the specifics of these quality attributes.- BDX has a Quality Grade of C, ranking ahead of 56.62% of graded US stocks.
- BDX's asset turnover comes in at 0.365 -- ranking 118th of 186 Medical Equipment stocks.
- MYO, BTCY, and NURO are the stocks whose asset turnover ratios are most correlated with BDX.
The table below shows BDX's key quality metrics over time.
Period | Asset Turnover | Gross Margin | ROIC |
---|---|---|---|
2021-06-30 | 0.365 | 0.470 | 0.103 |
2021-03-31 | 0.347 | 0.469 | 0.092 |
2020-12-31 | 0.337 | 0.458 | 0.088 |
2020-09-30 | 0.321 | 0.443 | 0.059 |
2020-06-30 | 0.320 | 0.451 | 0.053 |
2020-03-31 | 0.333 | 0.462 | 0.062 |
BDX Price Target
For more insight on analysts targets of BDX, see our BDX price target page. And for a list of of all stocks sorted by upside potential based on analyst target price, see our Top Price Target page.
Average Price Target | $267.80 | Average Broker Recommendation | 1.58 (Moderate Buy) |
Becton Dickinson & Co. (BDX) Company Bio
Becton, Dickinson and Company provides solutions which are focused on improving medication management and patient safety, supporting infection prevention practices, equipping surgical and interventional procedures, improving drug delivery, aiding anesthesiology and respiratory care, advancing cellular research and applications, enhancing the diagnosis of infectious diseases and cancers, and supporting the management of diabetes. The company was founded in 1897 and is based in Franklin Lakes, New Jersey.
Latest BDX News From Around the Web
Below are the latest news stories about BECTON DICKINSON & CO that investors may wish to consider to help them evaluate BDX as an investment opportunity.
Here's Why You Should Hold BD (BDX) Stock in Your PortfolioBD's (BDX) slew of product launches raises optimism about the stock. |
BD Ranks in Top 10 for Transparency, Awarded Best Code of Conduct in 2023 U.S. Transparency AwardsBD (Becton, Dickinson and Company) (NYSE: BDX), a leading global medical technology company, today announced it has been ranked in the top 10 for overall transparency and awarded Best Code of Conduct among S&P 250 companies in the fifth annual U.S. Transparency Awards by Labrador, a global communications firm specializing in corporate disclosures. |
BD's (BDX) Tie-Up to Explore Flow Cytometry for Clinical OutcomesBD's (BDX) latest partnership is likely to accelerate the delivery of innovative personalized therapies to patients who need them the most. |
Here's Why We Think Becton Dickinson (NYSE:BDX) Is Well Worth WatchingIt's common for many investors, especially those who are inexperienced, to buy shares in companies with a good story... |
Navigate BioPharma Services, Inc. Announces Collaboration with BD (Becton, Dickinson and Company) to Advance Capabilities for Clinical Phases of Drug DevelopmentNavigate BioPharma Services, Inc., a specialty laboratory offering high-quality, innovative precision medicine solutions and bioanalytics for clinical development and diagnostic applications, announces a strategic collaboration with BD (Becton, Dickinson and Company) (NYSE:BDX), a leading global medical technology company, to explore opportunities to develop and commercialize flow cytometry-based companion diagnostics and tools for clinical decisions. |
BDX Price Returns
1-mo | -4.96% |
3-mo | 3.75% |
6-mo | 10.71% |
1-year | 15.04% |
3-year | 28.23% |
5-year | 10.97% |
YTD | 5.43% |
2022 | 5.15% |
2021 | 1.88% |
2020 | -6.75% |
2019 | 22.20% |
2018 | 6.61% |
BDX Dividends
Ex-Dividend Date | Type | Payout Amount | Change | ||||||
---|---|---|---|---|---|---|---|---|---|
Loading, please wait... |
Continue Researching BDX
Here are a few links from around the web to help you further your research on Becton Dickinson & Co's stock as an investment opportunity:Becton Dickinson & Co (BDX) Stock Price | Nasdaq
Becton Dickinson & Co (BDX) Stock Quote, History and News - Yahoo Finance
Becton Dickinson & Co (BDX) Stock Price and Basic Information | MarketWatch
Loading social stream, please wait...