
Saul Centers, Inc. (BFS): Price and Financial Metrics
BFS Price/Volume Stats
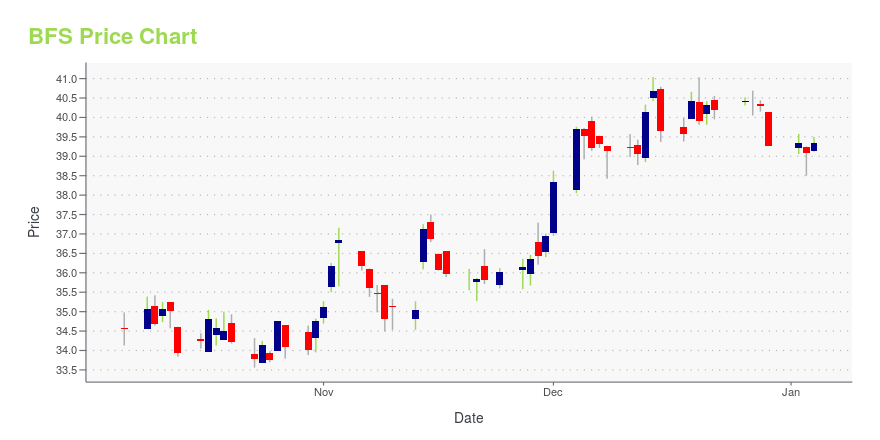
| Current price | $38.90 | 52-week high | $41.04 |
| Prev. close | $38.43 | 52-week low | $33.56 |
| Day low | $38.58 | Volume | 37,300 |
| Day high | $39.20 | Avg. volume | 54,364 |
| 50-day MA | $37.15 | Dividend yield | 6.04% |
| 200-day MA | $37.22 | Market Cap | 932.90M |
BFS Stock Price Chart Interactive Chart >
Saul Centers, Inc. (BFS) Company Bio
Saul Centers operates and manages community and neighborhood shopping center and office properties. The company was founded in 1993 and is based in Bethesda, Maryland.
Latest BFS News From Around the Web
Below are the latest news stories about SAUL CENTERS INC that investors may wish to consider to help them evaluate BFS as an investment opportunity.
Saul Centers Inc (BFS) Reports 4.4% Increase in Total Revenue for Q3 2023Net income and FFO also see significant growth, with a 7.8% and 4.4% increase respectively |
Saul Centers: Q3 Earnings SnapshotBETHESDA, Md. (AP) — Saul Centers Inc. (BFS) on Thursday reported a key measure of profitability in its third quarter. The real estate investment trust, based in Bethesda, Maryland, said it had funds from operations of $26 million, or 76 cents per share, in the period. Funds from operations is a closely watched measure in the REIT industry. |
Saul Centers, Inc. Reports Third Quarter 2023 EarningsSaul Centers, Inc. (NYSE: BFS), an equity real estate investment trust ("REIT"), announced operating results for the quarter ended September 30, 2023 ("2023 Quarter"). Total revenue for the 2023 Quarter increased to $63.8 million from $61.1 million for the quarter ended September 30, 2022 ("2022 Quarter"). Net income increased to $16.7 million for the 2023 Quarter from $15.5 million for the 2022 Quarter primarily due to (a) higher commercial base rent of $1.3 million, (b) higher residential base |
Saul Centers Inc's Dividend AnalysisSaul Centers Inc(NYSE:BFS) recently announced a dividend of $0.59 per share, payable on 2023-10-31, with the ex-dividend date set for 2023-10-13. As investors look forward to this upcoming payment, the spotlight also shines on the company's dividend history, yield, and growth rates. Using the data from GuruFocus, let's delve into Saul Centers Inc's dividend performance and assess its sustainability. |
Saul Centers Declares Quarterly DividendsSaul Centers, Inc. (NYSE: BFS) has declared a quarterly dividend of $0.59 per share on its common stock, to be paid on October 31, 2023, to holders of record on October 16, 2023. The common dividend is unchanged from the amount paid in the previous quarter and the amount paid in the prior year's comparable quarter. |
BFS Price Returns
| 1-mo | 10.32% |
| 3-mo | 11.19% |
| 6-mo | 1.09% |
| 1-year | 8.43% |
| 3-year | 1.78% |
| 5-year | -4.66% |
| YTD | 3.75% |
| 2023 | 2.65% |
| 2022 | -19.38% |
| 2021 | 76.58% |
| 2020 | -36.18% |
| 2019 | 16.33% |
BFS Dividends
| Ex-Dividend Date | Type | Payout Amount | Change | ||||||
|---|---|---|---|---|---|---|---|---|---|
| Loading, please wait... | |||||||||
Continue Researching BFS
Want to do more research on Saul Centers Inc's stock and its price? Try the links below:Saul Centers Inc (BFS) Stock Price | Nasdaq
Saul Centers Inc (BFS) Stock Quote, History and News - Yahoo Finance
Saul Centers Inc (BFS) Stock Price and Basic Information | MarketWatch
Loading social stream, please wait...