
Cass Information Systems, Inc (CASS): Price and Financial Metrics
CASS Price/Volume Stats
| Current price | $42.06 | 52-week high | $50.25 |
| Prev. close | $40.95 | 52-week low | $35.50 |
| Day low | $40.93 | Volume | 40,988 |
| Day high | $42.07 | Avg. volume | 42,332 |
| 50-day MA | $41.85 | Dividend yield | 2.94% |
| 200-day MA | $43.10 | Market Cap | 573.87M |
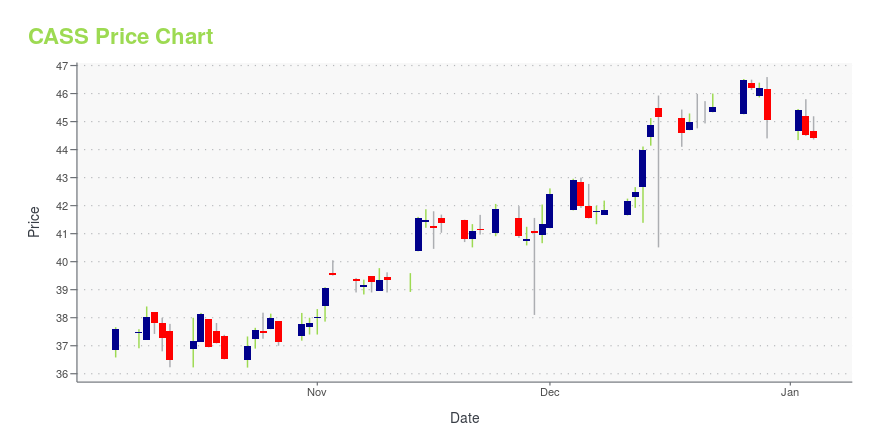
CASS Stock Price Chart Interactive Chart >
Cass Information Systems, Inc (CASS) Company Bio
Cass Information Services provides payment and information processing services to manufacturing, distribution, and retail enterprises in the United States. It operates through two segments, Information Services and Banking Services. The company was founded in 1906 and is based in St. Louis, Missouri.
Latest CASS News From Around the Web
Below are the latest news stories about CASS INFORMATION SYSTEMS INC that investors may wish to consider to help them evaluate CASS as an investment opportunity.
Cass Information Systems (NASDAQ:CASS) investors are sitting on a loss of 14% if they invested five years agoCass Information Systems, Inc. ( NASDAQ:CASS ) shareholders should be happy to see the share price up 12% in the last... |
October shipments hit cycle low, Cass saysOctober freight data from Cass Information Systems showed continued softness into peak season. The post October shipments hit cycle low, Cass says appeared first on FreightWaves. |
Cass Information Systems (NASDAQ:CASS) Will Pay A Larger Dividend Than Last Year At $0.30The board of Cass Information Systems, Inc. ( NASDAQ:CASS ) has announced that it will be paying its dividend of $0.30... |
Cass Information Systems (CASS) Lags Q3 Earnings EstimatesCass (CASS) delivered earnings and revenue surprises of -1.82% and 2.38%, respectively, for the quarter ended September 2023. Do the numbers hold clues to what lies ahead for the stock? |
Cass Information Systems Reports Third Quarter 2023 ResultsST. LOUIS, October 19, 2023--Cass Information Systems, Inc. (Nasdaq: CASS), (the Company or Cass) reported third quarter 2023 earnings of $0.54 per diluted share, as compared to $0.64 in the third quarter of 2022 and $0.52 in the second quarter of 2023. Net income for the period was $7.4 million, a decrease of 16.0% from $8.8 million in the same period in 2022 and an increase of $256,000, or 3.6%, as compared to the second quarter of 2023. |
CASS Price Returns
| 1-mo | 5.68% |
| 3-mo | -2.88% |
| 6-mo | -3.09% |
| 1-year | 12.54% |
| 3-year | 10.67% |
| 5-year | -4.93% |
| YTD | -5.37% |
| 2023 | 1.13% |
| 2022 | 20.03% |
| 2021 | 3.60% |
| 2020 | -30.88% |
| 2019 | 11.39% |
CASS Dividends
| Ex-Dividend Date | Type | Payout Amount | Change | ||||||
|---|---|---|---|---|---|---|---|---|---|
| Loading, please wait... | |||||||||
Continue Researching CASS
Want to do more research on Cass Information Systems Inc's stock and its price? Try the links below:Cass Information Systems Inc (CASS) Stock Price | Nasdaq
Cass Information Systems Inc (CASS) Stock Quote, History and News - Yahoo Finance
Cass Information Systems Inc (CASS) Stock Price and Basic Information | MarketWatch
Loading social stream, please wait...