Cincinnati Financial Corp. (CINF): Price and Financial Metrics
CINF Price/Volume Stats
| Current price | $123.96 | 52-week high | $128.23 |
| Prev. close | $120.30 | 52-week low | $96.86 |
| Day low | $115.43 | Volume | 889,400 |
| Day high | $125.77 | Avg. volume | 782,021 |
| 50-day MA | $117.83 | Dividend yield | 2.67% |
| 200-day MA | $111.77 | Market Cap | 19.41B |
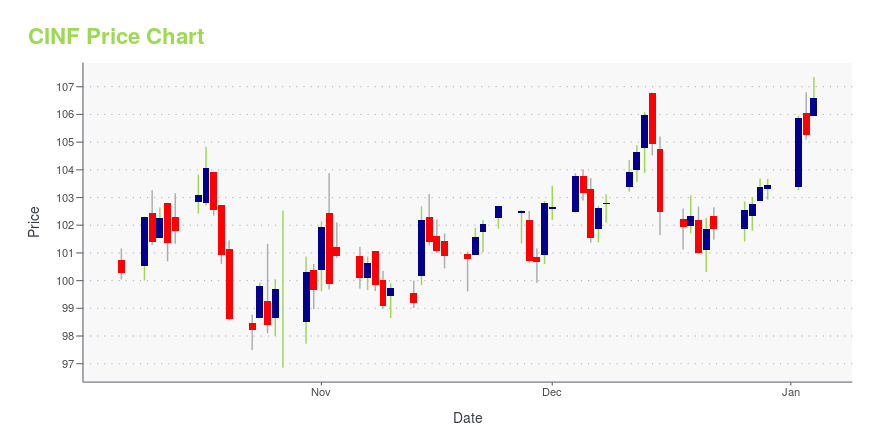
CINF Stock Price Chart Interactive Chart >
Cincinnati Financial Corp. (CINF) Company Bio
Cincinnati Financial Corporation offers property and casualty insurance, its main business, through The Cincinnati Insurance Company, The Cincinnati Indemnity Company and The Cincinnati Casualty Company. The company has 1.01% of the domestic property and casualty insurance premiums, which ranks it as the 20th largest insurance company by market share in the U.S. (Source:Wikipedia)
Latest CINF News From Around the Web
Below are the latest news stories about CINCINNATI FINANCIAL CORP that investors may wish to consider to help them evaluate CINF as an investment opportunity.
Cincinnati Financial Corp's Dividend AnalysisCincinnati Financial Corp (NASDAQ:CINF) recently announced a dividend of $0.75 per share, payable on 2024-01-16, with the ex-dividend date set for 2023-12-18. As investors look forward to this upcoming payment, the spotlight also shines on the company's dividend history, yield, and growth rates. Using the data from GuruFocus, let's look into Cincinnati Financial Corps dividend performance and assess its sustainability. |
Zacks Industry Outlook Highlights Berkshire Hathaway, Chubb, Arch Capital, W.R. Berkley and Cincinnati FinancialBerkshire Hathaway, Chubb, Arch Capital, W.R. Berkley and Cincinnati Financial have been highlighted in this Industry Outlook article. |
15 Best Property and Casualty Insurance Companies Heading into 2024In this article, we will take a look at the 15 best property and casualty insurance companies heading into 2024. If you want to skip our detailed analysis, you can go directly to the 5 Best Property and Casualty Insurance Companies Heading into 2024. The Global Property and Casualty Insurance Industry: A Market Analysis According […] |
Be Sure To Check Out Cincinnati Financial Corporation (NASDAQ:CINF) Before It Goes Ex-DividendSome investors rely on dividends for growing their wealth, and if you're one of those dividend sleuths, you might be... |
Here's Why You Should Buy Cincinnati Financial (CINF) StockHigher level of insured exposures, rate increase, agent-focused business model, consistent cash flow and a solid capital position poise Cincinnati Financial (CINF) well for growth. |
CINF Price Returns
| 1-mo | 7.85% |
| 3-mo | 12.60% |
| 6-mo | 12.02% |
| 1-year | 24.25% |
| 3-year | 15.50% |
| 5-year | 31.21% |
| YTD | 21.50% |
| 2023 | 4.00% |
| 2022 | -7.89% |
| 2021 | 33.28% |
| 2020 | -14.15% |
| 2019 | 38.87% |
CINF Dividends
| Ex-Dividend Date | Type | Payout Amount | Change | ||||||
|---|---|---|---|---|---|---|---|---|---|
| Loading, please wait... | |||||||||
Continue Researching CINF
Want to see what other sources are saying about Cincinnati Financial Corp's financials and stock price? Try the links below:Cincinnati Financial Corp (CINF) Stock Price | Nasdaq
Cincinnati Financial Corp (CINF) Stock Quote, History and News - Yahoo Finance
Cincinnati Financial Corp (CINF) Stock Price and Basic Information | MarketWatch


Loading social stream, please wait...