
Costco Wholesale Corporation (COST): Price and Financial Metrics
COST Price/Volume Stats
| Current price | $729.18 | 52-week high | $787.08 |
| Prev. close | $721.86 | 52-week low | $476.75 |
| Day low | $715.00 | Volume | 1,524,400 |
| Day high | $730.95 | Avg. volume | 2,055,726 |
| 50-day MA | $730.25 | Dividend yield | 0.56% |
| 200-day MA | $631.39 | Market Cap | 323.39B |
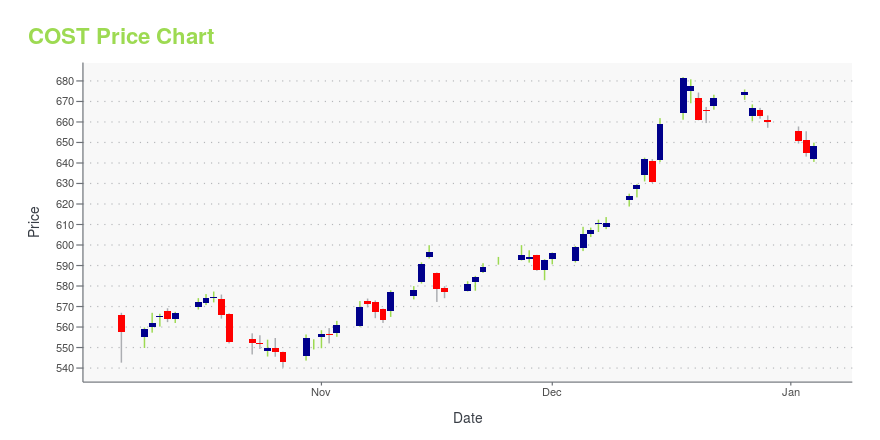
COST Stock Price Chart Interactive Chart >
Costco Wholesale Corporation (COST) Company Bio
Costco Wholesale operates membership warehouses, offering branded and private-label products in a range of merchandise categories. The company also operates gas stations, pharmacies, food courts, optical dispensing centers, photo processing centers, and hearing-aid centers,; and engages in the travel business. The company was founded in 1976 and is based in Issaquah, Washington.
Latest COST News From Around the Web
Below are the latest news stories about COSTCO WHOLESALE CORP that investors may wish to consider to help them evaluate COST as an investment opportunity.
The 500 Top Stocks to Buy for 2024, Ranked by AIThese are the very best stocks to buy for 2024 for any investor, according to Tom Yeung's MarketMasterAI system. |
Checkout Champs: 3 Retail Stocks Committed to Self-Service SuccessThere is a divide amongst retail stocks on whether self-checkout is good business. |
Stock-Split Watch: Will Costco and MercadoLibre Split Their Stocks in 2024?If a bull market comes, prices are going to rise. |
Costco doubles down on a different type of bargain, shoppingWhile Costco has built its business on offering low prices, it has also embraced the treasure-hunt shopping model. The warehouse club always offers food and household basics, but sometimes you visit and your local store offers kayaks, huge Teddy bears, cashmere sweaters and nearly anything else. The treasure-hunt aspect may not be the main reason you'd join Costco, but it does add to the fun of shopping there. |
Costco Wholesale Is a Fabulous Company. Here's Why I Won't Buy the Stock in 2024.The warehouse retailer has had a great year, but the stock could run out of gas soon. |
COST Price Returns
| 1-mo | -0.31% |
| 3-mo | 6.48% |
| 6-mo | 35.06% |
| 1-year | 49.52% |
| 3-year | 106.46% |
| 5-year | 217.88% |
| YTD | 10.81% |
| 2023 | 49.00% |
| 2022 | -19.05% |
| 2021 | 51.82% |
| 2020 | 29.28% |
| 2019 | 45.70% |
COST Dividends
| Ex-Dividend Date | Type | Payout Amount | Change | ||||||
|---|---|---|---|---|---|---|---|---|---|
| Loading, please wait... | |||||||||
Continue Researching COST
Here are a few links from around the web to help you further your research on Costco Wholesale Corp's stock as an investment opportunity:Costco Wholesale Corp (COST) Stock Price | Nasdaq
Costco Wholesale Corp (COST) Stock Quote, History and News - Yahoo Finance
Costco Wholesale Corp (COST) Stock Price and Basic Information | MarketWatch
Loading social stream, please wait...