
Chesapeake Utilities Corporation (CPK): Price and Financial Metrics
CPK Price/Volume Stats
| Current price | $119.46 | 52-week high | $124.72 |
| Prev. close | $117.81 | 52-week low | $83.79 |
| Day low | $117.40 | Volume | 114,100 |
| Day high | $119.64 | Avg. volume | 124,229 |
| 50-day MA | $110.04 | Dividend yield | 2.14% |
| 200-day MA | $103.16 | Market Cap | 2.66B |
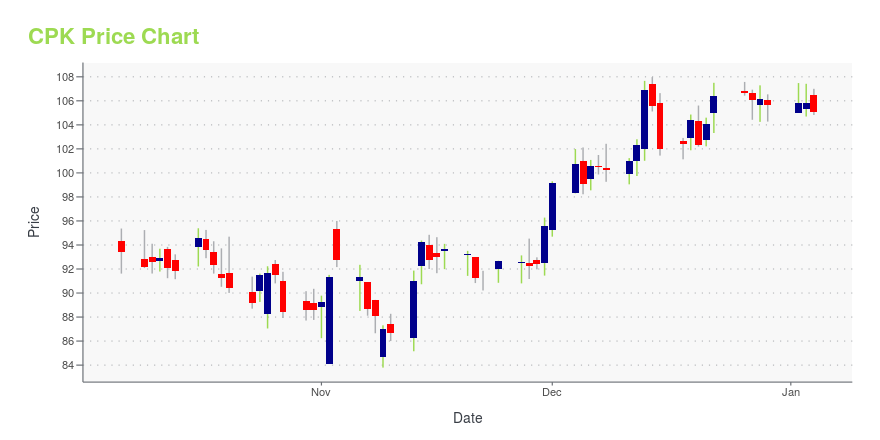
CPK Stock Price Chart Interactive Chart >
Chesapeake Utilities Corporation (CPK) Company Bio
Chesapeake Utilities Corporation is a diversified energy company engaged in natural gas distribution, transmission, gathering and processing, electricity distribution, propane gas distribution, wholesale marketing, and other businesses. The company was founded in 1859 and is based in Dover, Delaware.
Latest CPK News From Around the Web
Below are the latest news stories about CHESAPEAKE UTILITIES CORP that investors may wish to consider to help them evaluate CPK as an investment opportunity.
Chesapeake Utilities Corporation Expands Propane Services in North Carolina with Acquisition of J.T. Lee and Son'sChesapeake Utilities Corporation (NYSE: CPK) announced today that its subsidiary, Sharp Energy, has acquired the propane operating assets of J.T. Lee and Son's in Cape Fear, North Carolina. Through this acquisition, Sharp Energy expands its customer base in North Carolina, including adding approximately 3,000 customers and distribution of approximately 800,000 gallons of propane annually. The transaction also includes a bulk plant with 60,000 gallons of propane storage, enabling the Company to r |
Sidoti Events, LLC's Virtual December Small-Cap ConferenceNEW YORK, NY / ACCESSWIRE / December 5, 2023 / Sidoti Events, LLC, an affiliate of Sidoti & Company, LLC, has released the presentation schedule and weblinks for its two-day December Small-Cap Conference taking place Wednesday and Thursday, December ... |
Chesapeake Utilities Corporation Completes Acquisition of Florida City GasChesapeake Utilities Corporation (NYSE: CPK) today announced the completion of the acquisition of Florida City Gas (FCG), which is now a wholly-owned subsidiary of the Company. This transaction represents an expansion of Chesapeake Utilities' footprint in the dynamic and high-growth market of Florida, encompassing five of the top 10 most populous counties. By more than doubling Chesapeake Utilities' customer base and natural gas infrastructure in the state, the Company is positioned for substant |
Chesapeake Utilities Corporation to Present at Sidoti Virtual Investor Conference December 6, 2023The Company announced today that members of Management of Chesapeake Utilities Corporation (NYSE: CPK) will present and host one-on-one meetings with investors at the Sidoti December Virtual Investor Conference taking place on December 6-7, 2023. |
The one-year underlying earnings growth at Chesapeake Utilities (NYSE:CPK) is promising, but the shareholders are still in the red over that timePassive investing in an index fund is a good way to ensure your own returns roughly match the overall market. But if... |
CPK Price Returns
| 1-mo | 13.51% |
| 3-mo | 14.31% |
| 6-mo | 18.67% |
| 1-year | 1.79% |
| 3-year | 1.58% |
| 5-year | 41.00% |
| YTD | 14.42% |
| 2023 | -8.83% |
| 2022 | -17.61% |
| 2021 | 36.78% |
| 2020 | 15.15% |
| 2019 | 19.88% |
CPK Dividends
| Ex-Dividend Date | Type | Payout Amount | Change | ||||||
|---|---|---|---|---|---|---|---|---|---|
| Loading, please wait... | |||||||||
Continue Researching CPK
Want to see what other sources are saying about Chesapeake Utilities Corp's financials and stock price? Try the links below:Chesapeake Utilities Corp (CPK) Stock Price | Nasdaq
Chesapeake Utilities Corp (CPK) Stock Quote, History and News - Yahoo Finance
Chesapeake Utilities Corp (CPK) Stock Price and Basic Information | MarketWatch
Loading social stream, please wait...