Cheniere Energy Partners L.P. (CQP): Price and Financial Metrics
CQP Price/Volume Stats
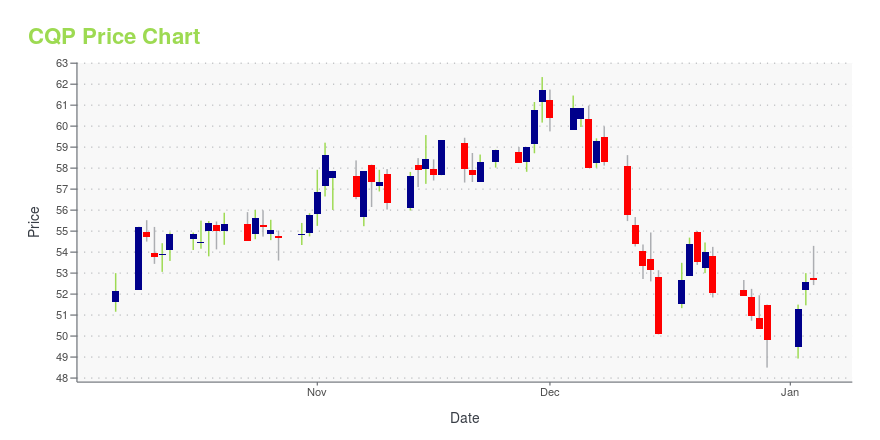
Current price | $48.24 | 52-week high | $62.34 |
Prev. close | $48.53 | 52-week low | $42.96 |
Day low | $48.03 | Volume | 109,300 |
Day high | $48.92 | Avg. volume | 195,808 |
50-day MA | $50.83 | Dividend yield | 6.48% |
200-day MA | $52.01 | Market Cap | 23.35B |
CQP Stock Price Chart Interactive Chart >
CQP POWR Grades
- CQP scores best on the Quality dimension, with a Quality rank ahead of 89.21% of US stocks.
- CQP's strongest trending metric is Stability; it's been moving down over the last 26 weeks.
- CQP's current lowest rank is in the Growth metric (where it is better than 15.37% of US stocks).
CQP Stock Summary
- CHENIERE ENERGY PARTNERS LP's capital turnover -- a measure of revenue relative to shareholder's equity -- is better than just 1.29% of US listed stocks.
- CQP's equity multiplier -- a measure of assets relative to shareholders'equity -- is greater than that of only 1.69% of US stocks.
- In terms of twelve month growth in earnings before interest and taxes, CHENIERE ENERGY PARTNERS LP is reporting a growth rate of 404.36%; that's higher than 97.12% of US stocks.
- Stocks with similar financial metrics, market capitalization, and price volatility to CHENIERE ENERGY PARTNERS LP are AHT, WHLR, USAC, UNIT, and FLNG.
- CQP's SEC filings can be seen here. And to visit CHENIERE ENERGY PARTNERS LP's official web site, go to cheniere-partners.
CQP Valuation Summary
- CQP's price/earnings ratio is 4.2; this is 50.88% lower than that of the median Energy stock.
- Over the past 152 months, CQP's price/sales ratio has gone down 8.1.
Below are key valuation metrics over time for CQP.
Stock | Date | P/S | P/B | P/E | EV/EBIT |
---|---|---|---|---|---|
CQP | 2023-12-28 | 2.1 | -25.0 | 4.2 | 5.9 |
CQP | 2023-12-27 | 2.1 | -25.4 | 4.2 | 6.0 |
CQP | 2023-12-26 | 2.1 | -25.8 | 4.3 | 6.1 |
CQP | 2023-12-22 | 2.2 | -25.9 | 4.3 | 6.1 |
CQP | 2023-12-21 | 2.2 | -26.9 | 4.5 | 6.2 |
CQP | 2023-12-20 | 2.2 | -26.6 | 4.4 | 6.2 |
CQP Growth Metrics
- The 5 year cash and equivalents growth rate now stands at 143.78%.
- Its 2 year revenue growth rate is now at 58.65%.
- Its year over year price growth rate is now at 34.99%.
The table below shows CQP's growth in key financial areas (numbers in millions of US dollars).
Date | Revenue | Operating Cash Flow | Net Income to Common Stock |
---|---|---|---|
2022-12-31 | 17,206 | 4,149 | 2,498 |
2022-09-30 | 15,743 | 3,066 | 494 |
2022-06-30 | 13,091 | 2,802 | 1,389 |
2022-03-31 | 10,799 | 2,503 | 1,442 |
2021-12-31 | 9,434 | 2,291 | 1,630 |
2021-09-30 | 8,173 | 2,085 | 1,532 |
CQP's Quality Factors
The “Quality” component of the POWR Ratings focuses on 31 different factors of a companies fundamentals and operational strength. Here are some key insights as we drill into the specifics of these quality attributes.- CQP has a Quality Grade of C, ranking ahead of 37.71% of graded US stocks.
- CQP's asset turnover comes in at 0.357 -- ranking 21st of 105 Utilities stocks.
- WES, LNG, and ARTNA are the stocks whose asset turnover ratios are most correlated with CQP.
The table below shows CQP's key quality metrics over time.
Period | Asset Turnover | Gross Margin | ROIC |
---|---|---|---|
2021-06-30 | 0.357 | 0.389 | 0.057 |
2021-03-31 | 0.336 | 0.427 | 0.058 |
2020-12-31 | 0.323 | 0.453 | 0.061 |
2020-09-30 | 0.317 | 0.467 | 0.063 |
2020-06-30 | 0.342 | 0.463 | 0.069 |
2020-03-31 | 0.354 | 0.414 | 0.065 |
Cheniere Energy Partners L.P. (CQP) Company Bio
Cheniere Energy, Inc. is a liquefied natural gas (LNG) company headquartered in Houston, Texas. In February 2016 it became the first US company to export liquefied natural gas. As of 2018 it is a Fortune 500 company. (Source:Wikipedia)
Latest CQP News From Around the Web
Below are the latest news stories about CHENIERE ENERGY PARTNERS LP that investors may wish to consider to help them evaluate CQP as an investment opportunity.
LNG developer Tellurian hires financial adviserHOUSTON (Reuters) -Struggling liquefied natural gas (LNG) developer Tellurian on Thursday said it has hired a financial adviser to assist in balance sheet management. Tellurian ousted its chairman and co-founder Charif Souki, earlier this month weeks after auditors raised doubts about the company's ability to cover future expenses. Chairman Martin Houston in a letter to shareholders said the adviser will "assist with shaping commercial structures as well as balance sheet management." |
16 Most Promising Dividend Stocks According to AnalystsIn this article, we discuss 16 most promising dividend stocks according to analysts. You can skip our detailed analysis of dividend stocks and their performance over the years, and go directly to read 5 Most Promising Dividend Stocks According to Analysts. This year brought a notable shift in the investment scene, where technology stocks surged […] |
LNG pioneer Charif Souki leaves Tellurian with $8mn after oustingCharif Souki, a pioneer of the US liquefied natural gas industry, will receive a payout of more than $8mn after being ousted from project developer Tellurian as the company struggles to get a costly gas export project off the ground. Tellurian, co-founded by Souki in 2016, said in a regulatory filing on Wednesday that he had resigned from its board of directors effective this week. The announcement came after he was terminated as executive chair earlier this month “without cause”, according to the company. |
EXPLAINER-How would the Red Sea attacks affect gas shipping?Several shipping companies and a few liquefied natural gas (LNG) tankers have decided to avoid the world's main East-West trade route, following attacks launched by Yemen's Houthi group on commercial ships at the southern end of the Red Sea. IS THE RED SEA ROUTE IMPORTANT FOR THE LNG MARKET? The attacks have made reaching the Suez Canal more perilous. |
Here's Why Cheniere Energy (LNG) is a Strong Value StockWondering how to pick strong, market-beating stocks for your investment portfolio? Look no further than the Zacks Style Scores. |
CQP Price Returns
1-mo | -7.25% |
3-mo | -8.01% |
6-mo | -11.32% |
1-year | 21.18% |
3-year | 38.06% |
5-year | 56.86% |
YTD | -1.12% |
2023 | -5.09% |
2022 | 44.79% |
2021 | 27.83% |
2020 | -4.97% |
2019 | 16.60% |
CQP Dividends
Ex-Dividend Date | Type | Payout Amount | Change | ||||||
---|---|---|---|---|---|---|---|---|---|
Loading, please wait... |
Continue Researching CQP
Want to see what other sources are saying about Cheniere Energy Partners LP's financials and stock price? Try the links below:Cheniere Energy Partners LP (CQP) Stock Price | Nasdaq
Cheniere Energy Partners LP (CQP) Stock Quote, History and News - Yahoo Finance
Cheniere Energy Partners LP (CQP) Stock Price and Basic Information | MarketWatch
Loading social stream, please wait...