Deere & Co. (DE): Price and Financial Metrics
GET POWR RATINGS... FREE!
DE POWR Grades
- Sentiment is the dimension where DE ranks best; there it ranks ahead of 97.32% of US stocks.
- The strongest trend for DE is in Value, which has been heading down over the past 179 days.
- DE ranks lowest in Quality; there it ranks in the 30th percentile.
DE Stock Summary
- Deere & Co's market capitalization of $126,677,384,305 is ahead of 98.06% of US-listed equities.
- DE's went public 36.27 years ago, making it older than 92.84% of listed US stocks we're tracking.
- For DE, its debt to operating expenses ratio is greater than that reported by 87.2% of US equities we're observing.
- Stocks that are quantitatively similar to DE, based on their financial statements, market capitalization, and price volatility, are SNY, CAT, IBM, GSK, and MDT.
- DE's SEC filings can be seen here. And to visit Deere & Co's official web site, go to www.deere.com.
DE Valuation Summary
- DE's price/sales ratio is 2.8; this is 15.15% lower than that of the median Industrials stock.
- Over the past 243 months, DE's price/sales ratio has gone up 2.
- DE's price/earnings ratio has moved down 2.1 over the prior 243 months.
Below are key valuation metrics over time for DE.
Stock | Date | P/S | P/B | P/E | EV/EBIT |
---|---|---|---|---|---|
DE | 2021-08-26 | 2.8 | 7.5 | 21.7 | 19.4 |
DE | 2021-08-25 | 2.9 | 7.8 | 25.6 | 21.5 |
DE | 2021-08-24 | 2.9 | 7.6 | 25.1 | 21.2 |
DE | 2021-08-23 | 2.8 | 7.5 | 24.7 | 21.0 |
DE | 2021-08-20 | 2.8 | 7.3 | 23.9 | 20.5 |
DE | 2021-08-19 | 2.8 | 7.4 | 24.4 | 20.8 |
DE Growth Metrics
- The 3 year net income to common stockholders growth rate now stands at 106.42%.
- Its 2 year net cashflow from operations growth rate is now at 392.83%.
- The year over year net income to common stockholders growth rate now stands at 63.49%.

The table below shows DE's growth in key financial areas (numbers in millions of US dollars).
Date | Revenue | Operating Cash Flow | Net Income to Common Stock |
---|---|---|---|
2021-12-31 | 44,481 | 5,030 | 5,642 |
2021-09-30 | 44,024 | 7,726 | 5,963 |
2021-06-30 | 42,428 | 7,740 | 5,438 |
2021-03-31 | 39,826 | 8,493 | 4,582 |
2020-12-31 | 37,021 | 8,134 | 3,458 |
2020-09-30 | 35,540 | 7,483 | 2,751 |
DE's Quality Factors
The “Quality” component of the POWR Ratings focuses on 31 different factors of a companies fundamentals and operational strength. Here are some key insights as we drill into the specifics of these quality attributes.- DE has a Quality Grade of C, ranking ahead of 47.93% of graded US stocks.
- DE's asset turnover comes in at 0.547 -- ranking 79th of 104 Machinery stocks.
- LECO, ZBRA, and DOV are the stocks whose asset turnover ratios are most correlated with DE.
The table below shows DE's key quality metrics over time.
Period | Asset Turnover | Gross Margin | ROIC |
---|---|---|---|
2021-08-01 | 0.547 | 0.345 | 0.072 |
2021-05-02 | 0.519 | 0.346 | 0.065 |
2021-01-31 | 0.485 | 0.341 | 0.053 |
2020-11-01 | 0.472 | 0.334 | 0.046 |
2020-08-02 | 0.477 | 0.329 | 0.044 |
2020-05-03 | 0.498 | 0.322 | 0.044 |
DE Price Target
For more insight on analysts targets of DE, see our DE price target page. And for a list of of all stocks sorted by upside potential based on analyst target price, see our Top Price Target page.
Average Price Target | $411.48 | Average Broker Recommendation | 1.58 (Moderate Buy) |
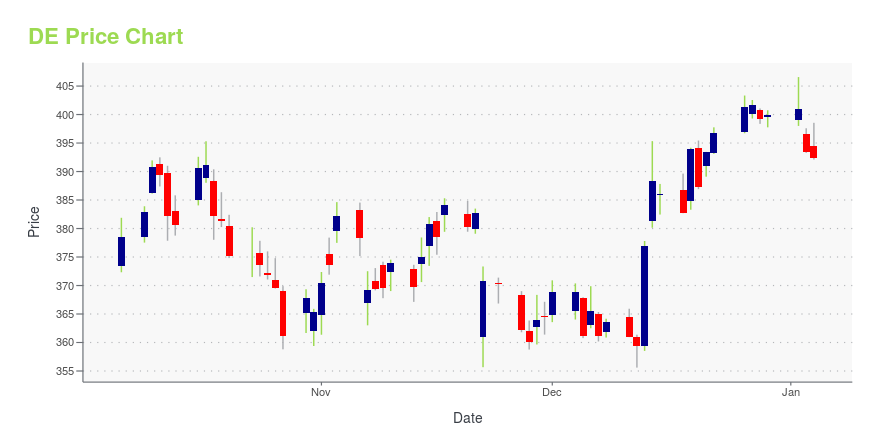
DE Stock Price Chart Interactive Chart >
DE Price/Volume Stats
Current price | $301.63 | 52-week high | $446.76 |
Prev. close | $299.47 | 52-week low | $294.29 |
Day low | $294.32 | Volume | 1,373,500 |
Day high | $304.87 | Avg. volume | 2,050,438 |
50-day MA | $352.50 | Dividend yield | 1.5% |
200-day MA | $364.84 | Market Cap | 92.19B |
Deere & Co. (DE) Company Bio
John Deere is the brand name of Deere & Company, an American corporation that manufactures agricultural, construction, and forestry machinery, diesel engines, drivetrains (axles, transmissions, gearboxes) used in heavy equipment, and lawn care equipment. In 2019, it was listed as 87th in the Fortune 500 America's ranking and was ranked 329th in the global ranking. The company also provides financial services and other related activities. (Source:Wikipedia)
Latest DE News From Around the Web
Below are the latest news stories about Deere & Co that investors may wish to consider to help them evaluate DE as an investment opportunity.
Down 9.3% in 4 Weeks, Here's Why Deere (DE) Looks Ripe for a TurnaroundDeere (DE) has become technically an oversold stock now, which implies exhaustion of the heavy selling pressure on it. This, combined with strong agreement among Wall Street analysts in revising earnings estimates higher, indicates a potential trend reversal for the stock in the near term. |
John Deere Launches Innovation Hub in Austin, TexasDeere & Company (NYSE: DE) is expanding its U.S. footprint and technology operations with a new office in Austin, Texas. The new location enables Deere to further strengthen its technology capabilities and attract talent interested in solving some of the world's most pressing challenges – including feeding a growing population. |
John Deere opens technology hub near downtown AustinJohn Deere is rapidly becoming a tech company, and it has selected Austin to help expand its software capabilities. While Austin may not be known for its farming terrain, it's stocked with the type of tech talent Deere & Company wants to attract. The company expects Austin to become one of its largest and most impactful development hubs. |
Deere declares $1.05 dividendDeere (NYSE:DE) declares $1.05/share quarterly dividend, in line with previous. Forward yield 1.22% Payable May 9; for shareholders of record March 31; ex-div March 30. See DE Dividend Scorecard, Yield Chart, & Dividend Growth.... |
Deere declares $1.05 dividend (NYSE:DE)Deere & Company (NYSE:DE) declares $1.05/share quarterly dividend, in line with previous.Forward yield 1.22%Payable May 9; for shareholders of record March 31; ex-div March 30. |
DE Price Returns
1-mo | -16.14% |
3-mo | -26.39% |
6-mo | -19.36% |
1-year | N/A |
3-year | 92.72% |
5-year | 161.19% |
YTD | -11.49% |
2021 | 28.86% |
2020 | 57.96% |
2019 | 18.30% |
2018 | -2.90% |
2017 | 54.83% |
DE Dividends
Ex-Dividend Date | Type | Payout Amount | Change | ||||||
---|---|---|---|---|---|---|---|---|---|
Loading, please wait... |
Continue Researching DE
Want to see what other sources are saying about Deere & Co's financials and stock price? Try the links below:Deere & Co (DE) Stock Price | Nasdaq
Deere & Co (DE) Stock Quote, History and News - Yahoo Finance
Deere & Co (DE) Stock Price and Basic Information | MarketWatch
Loading social stream, please wait...