
ENI S.p.A. ADR (E): Price and Financial Metrics
E Price/Volume Stats
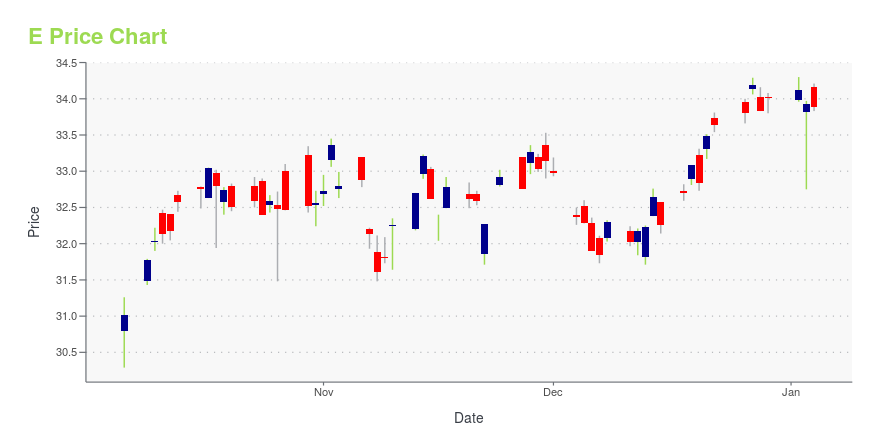
| Current price | $31.66 | 52-week high | $34.30 |
| Prev. close | $30.29 | 52-week low | $28.82 |
| Day low | $31.36 | Volume | 358,398 |
| Day high | $31.71 | Avg. volume | 311,613 |
| 50-day MA | $30.80 | Dividend yield | 4.61% |
| 200-day MA | $31.90 | Market Cap | 53.44B |
E Stock Price Chart Interactive Chart >
ENI S.p.A. ADR (E) Company Bio
Eni S.p.A. (Italian pronunciation: [ˈɛːni]) is an Italian multinational energy company headquartered in Rome. Considered one of the seven "supermajor" oil companies in the world, it has operations in 69 countries with a market capitalization of US$54.08 billion, as of 11 April 2022. The Italian government owns a 30.33% golden share in the company, 4.37% held through the Ministry of Economy and Finance and 25.96% through the Cassa Depositi e Prestiti. The company is a component of the Euro Stoxx 50 stock market index. (Source:Wikipedia)
Latest E News From Around the Web
Below are the latest news stories about ENI SPA that investors may wish to consider to help them evaluate E as an investment opportunity.
Eni (E) Strengthens Position as U.K.'s Leading CCS OperatorEni (E) accelerates the U.K.'s carbon capture journey through the expansion of HyNet, while also revealing the CCUS Vision and outlining plans for a second CCUS facility, the Bacton Energy Hub. |
Eni (E) and IOM Join Forces to Boost Youth Employment in LibyaEni's (E) North African branch signs a 5-year agreement with IOM to empower 850 Libyan youths, bridging skill gaps in agribusiness and industry. |
Eni (E) Signs Deal to Divest Minority Stake in Plenitude to EIPThe deal is expected to enhance Eni's (E) capital structure by reducing its consolidated net financial leverage and optimizing its capital base. |
Eni (E) Boosts UK CCS Leadership With CCUS Market LaunchEni (E) plays a significant role in the expansion of the HyNet Cluster, operating CO2 transport and storage within this initiative. |
Eni (E) Considers Selling Stake in Bioplastic Firm NovamontThe divestment of the stake aligns with Eni's (E) strategy to bolster the sustainability of its entire chemical business. |
E Price Returns
| 1-mo | 4.32% |
| 3-mo | -2.43% |
| 6-mo | 0.10% |
| 1-year | 10.07% |
| 3-year | 57.97% |
| 5-year | 25.17% |
| YTD | -4.82% |
| 2023 | 24.20% |
| 2022 | 8.63% |
| 2021 | 40.30% |
| 2020 | -30.20% |
| 2019 | 2.47% |
E Dividends
| Ex-Dividend Date | Type | Payout Amount | Change | ||||||
|---|---|---|---|---|---|---|---|---|---|
| Loading, please wait... | |||||||||
Continue Researching E
Want to see what other sources are saying about Eni Spa's financials and stock price? Try the links below:Eni Spa (E) Stock Price | Nasdaq
Eni Spa (E) Stock Quote, History and News - Yahoo Finance
Eni Spa (E) Stock Price and Basic Information | MarketWatch
Loading social stream, please wait...