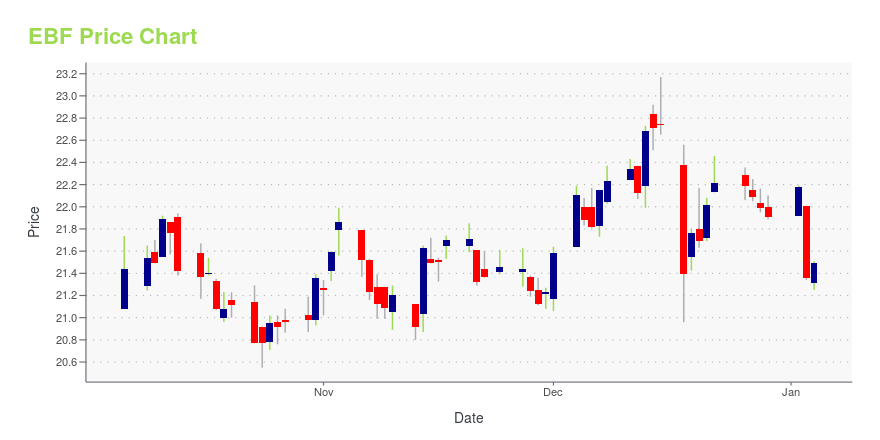
Ennis, Inc. (EBF): Price and Financial Metrics
EBF Stock Summary
- Ennis Inc's stock had its IPO on September 24, 1987, making it an older stock than 91.4% of US equities in our set.
- Of note is the ratio of Ennis Inc's sales and general administrative expense to its total operating expenses; 97.68% of US stocks have a lower such ratio.
- The volatility of Ennis Inc's share price is greater than that of just 6.12% US stocks with at least 200 days of trading history.
- If you're looking for stocks that are quantitatively similar to Ennis Inc, a group of peers worth examining would be WIRE, INUV, LWAY, HSON, and WEYS.
- EBF's SEC filings can be seen here. And to visit Ennis Inc's official web site, go to www.ennis.com.
EBF Stock Price Chart Interactive Chart >
EBF Price/Volume Stats
Current price | $20.33 | 52-week high | $21.11 |
Prev. close | $20.39 | 52-week low | $13.98 |
Day low | $20.00 | Volume | 99,600 |
Day high | $20.45 | Avg. volume | 132,295 |
50-day MA | $18.72 | Dividend yield | 4.43% |
200-day MA | $17.65 | Market Cap | 530.00M |
Ennis, Inc. (EBF) Company Bio
Ennis, Inc. produces and sells business forms and other business products; and activewear in the United States. The company operates in two segments, Print and Apparel. The company was founded in 1909 and is based in Midlothian, Texas.
EBF Price Forecast Based on DCF Valuation
Current Price | DCF Fair Value Target: | Forecasted Gain: |
$20.33 | $11.77 | -42% |
We started the process of determining a valid price forecast for Ennis Inc with a discounted cash flow analysis -- the results of which can be found in the table below. To summarize, we found that Ennis Inc ranked in the 40th percentile in terms of potential gain offered. Our DCF analysis suggests the stock is overvalued by about 41.83%. As for the metrics that stood out in our discounted cash flow analysis of Ennis Inc, consider:
- Its compound free cash flow growth rate, as measured over the past 5.67 years, is -0.03% -- higher than just 19.99% of stocks in our DCF forecasting set.
- EBF's estimated cost of debt, based largely on its market capitalization and its interest coverage ratio, is 3%; for context, that number is higher than 48.14% of tickers in our DCF set.
- Relative to other stocks in its sector (Industrials), Ennis Inc has a reliance on debt greater than just 10.05% of them.
Terminal Growth Rate in Free Cash Flow | Return Relative to Current Share Price |
0% | -43% |
1% | -43% |
2% | -42% |
3% | -42% |
4% | -41% |
5% | -40% |
CW, MIC, MIDD, PXS, and CLH can be thought of as valuation peers to EBF, in the sense that they are in the Industrials sector and have a similar price forecast based on DCF valuation.
Latest EBF News From Around the Web
Below are the latest news stories about Ennis Inc that investors may wish to consider to help them evaluate EBF as an investment opportunity.
What We Learned About Ennis' (NYSE:EBF) CEO CompensationThis article will reflect on the compensation paid to Keith Walters who has served as CEO of Ennis, Inc. ( NYSE:EBF... |
Hoggets easier by €8/head at Ennis Mart; steady trade seen at KilkennyWith factories pulling prices back for hoggets on Monday, AgriLand took a look at what the mart trade was like yesterday and the reports were mixed. Martin McNamara reported that hoggets were a much easier trade at Ennis, while George Candler reported a steady trade at Kilkenny, which saw hoggets make up to €151/head. Ennis Mart […] The post Hoggets easier by €8/head at Ennis Mart; steady trade seen at Kilkenny appeared first on Agriland.ie . |
Ennis Will Acquire Assets of InfosealMIDLOTHIAN, Texas--(BUSINESS WIRE)--Ennis, Inc. (the “Company"), (NYSE: EBF), today announced that one of its wholly owned subsidiaries has entered into a Letter of Intent to acquire the assets and assume some liabilities of Infoseal LLC (“Infoseal”) in Roanoke, Virginia. Infoseal provides pressure seal and tax forms products to independent print brokers and resellers. The Ennis subsidiary, operating under the Infoseal brand and name, will continue to operate in the current facility with a mult |
Ennis, Inc. Reports Results for the Three and Nine Months Ended November 30, 2020 and Declares Quarterly DividendEnnis, Inc. (the "Company"), (NYSE: EBF), today reported financial results for the three and nine months ended November 30, 2020. Highlights include: |
Ennis Earnings Report: Here’s what to expect from Stock market Insights & financial analysisEnnis announce their quarterly, annual earnings. See the latest EPS estimates. Listen to the conference call and remind yourself by… |
EBF Price Returns
1-mo | 9.71% |
3-mo | 25.19% |
6-mo | 16.04% |
1-year | 4.04% |
3-year | 17.19% |
5-year | 39.98% |
YTD | 15.30% |
2020 | -13.46% |
2019 | 17.54% |
2018 | -2.77% |
2017 | 24.65% |
2016 | 1.10% |
EBF Dividends
Ex-Dividend Date | Type | Payout Amount | Change | ||||||
---|---|---|---|---|---|---|---|---|---|
Loading, please wait... |
Continue Researching EBF
Here are a few links from around the web to help you further your research on Ennis Inc's stock as an investment opportunity:Ennis Inc (EBF) Stock Price | Nasdaq
Ennis Inc (EBF) Stock Quote, History and News - Yahoo Finance
Ennis Inc (EBF) Stock Price and Basic Information | MarketWatch
Get Free Updates
Join thousands of investors who get the latest news, insights and top rated picks from StockNews.com!
Loading social stream, please wait...