Consolidated Edison Inc. (ED): Price and Financial Metrics

Consolidated Edison Inc. (ED): $88.14

2.09 (-2.32%)

POWR Rating

Component Grades

Momentum

C

Stability

C

Sentiment

Quality

C

Add ED to Watchlist
Sign Up

Industry: Utilities - Domestic

Industry

F

Ranked

#18 of 65

in industry

ED Price/Volume Stats

Current price $88.14 52-week high $100.92
Prev. close $90.23 52-week low $78.10
Day low $87.89 Volume 874,427
Day high $90.17 Avg. volume 1,812,551
50-day MA $91.12 Dividend yield 3.57%
200-day MA $93.78 Market Cap 30.40B

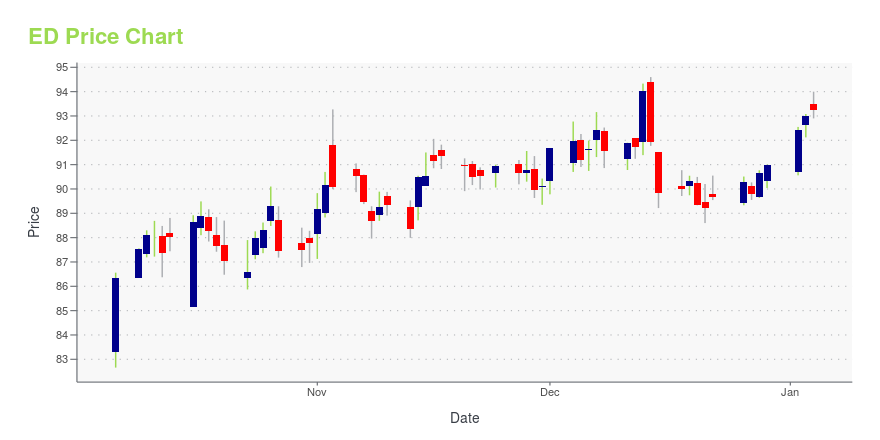
ED Stock Price Chart Interactive Chart >

ED POWR Grades

  • ED scores best on the Quality dimension, with a Quality rank ahead of 72.13% of US stocks.
  • ED's strongest trending metric is Momentum; it's been moving down over the last 177 days.
  • ED ranks lowest in Sentiment; there it ranks in the 3rd percentile.

ED Stock Summary

  • ED's went public 37.76 years ago, making it older than 93.16% of listed US stocks we're tracking.
  • Of note is the ratio of CONSOLIDATED EDISON INC's sales and general administrative expense to its total operating expenses; just 0.26% of US stocks have a lower such ratio.
  • The volatility of CONSOLIDATED EDISON INC's share price is greater than that of merely 1.15% US stocks with at least 200 days of trading history.
  • Stocks that are quantitatively similar to ED, based on their financial statements, market capitalization, and price volatility, are EIX, EQR, CEG, DTE, and O.
  • Visit ED's SEC page to see the company's official filings. To visit the company's web site, go to www.conedison.com.

ED Valuation Summary

  • ED's price/earnings ratio is 12.7; this is 35.53% lower than that of the median Utilities stock.
  • ED's price/earnings ratio has moved down 2.7 over the prior 243 months.

Below are key valuation metrics over time for ED.

Stock Date P/S P/B P/E EV/EBIT
ED 2023-09-22 2 1.5 12.7 13.2
ED 2023-09-21 2 1.5 12.7 13.2
ED 2023-09-20 2 1.5 12.8 13.3
ED 2023-09-19 2 1.5 12.8 13.2
ED 2023-09-18 2 1.5 12.8 13.3
ED 2023-09-15 2 1.5 12.8 13.3

ED Growth Metrics

    Its 5 year price growth rate is now at -6.1%.
  • Its 2 year price growth rate is now at 25.1%.
  • Its 4 year net cashflow from operations growth rate is now at -8.9%.
Over the past 15 months, ED's revenue has gone up $2,449,000,000.

The table below shows ED's growth in key financial areas (numbers in millions of US dollars).

Date Revenue Operating Cash Flow Net Income to Common Stock
2022-12-31 15,670 3,935 1,660
2022-09-30 15,055 3,639 1,694
2022-06-30 14,503 3,297 1,619
2022-03-31 14,059 2,917 1,529
2021-12-31 13,676 2,733 1,346
2021-09-30 13,221 2,542 1,165

ED's Quality Factors

The “Quality” component of the POWR Ratings focuses on 31 different factors of a companies fundamentals and operational strength. Here are some key insights as we drill into the specifics of these quality attributes.
  • ED has a Quality Grade of C, ranking ahead of 57.09% of graded US stocks.
  • ED's asset turnover comes in at 0.211 -- ranking 56th of 105 Utilities stocks.
  • AEP, SO, and CMS are the stocks whose asset turnover ratios are most correlated with ED.

The table below shows ED's key quality metrics over time.

Period Asset Turnover Gross Margin ROIC
2021-09-30 0.211 0.560 0.027
2021-06-30 0.209 0.566 0.027
2021-03-31 0.208 0.575 0.028
2020-12-31 0.203 0.584 0.030
2020-09-30 0.207 0.580 0.036
2020-06-30 0.211 0.569 0.037

ED Price Target

For more insight on analysts targets of ED, see our ED price target page. And for a list of of all stocks sorted by upside potential based on analyst target price, see our Top Price Target page.

Average Price Target $75.30 Average Broker Recommendation 2.31 (Moderate Sell)

Consolidated Edison Inc. (ED) Company Bio


Consolidated Edison, Inc., commonly known as Con Edison (stylized as conEdison) or ConEd, is one of the largest investor-owned energy companies in the United States, with approximately $12 billion in annual revenues as of 2017, and over $62 billion in assets. The company provides a wide range of energy-related products and services to its customers through its subsidiaries. (Source:Wikipedia)  


ED Latest News Stream


Event/Time News Detail
Loading, please wait...

ED Latest Social Stream


Loading social stream, please wait...

View Full ED Social Stream

Latest ED News From Around the Web

Below are the latest news stories about CONSOLIDATED EDISON INC that investors may wish to consider to help them evaluate ED as an investment opportunity.

CON EDISON TO WEBCAST CLEAN ENERGY FUTURE PRESENTATION ON OCTOBER 3

Consolidated Edison's corporate leadership will make a Clean Energy Future presentation from 9 a.m. to 10 a.m. on Tuesday, October 3.

Yahoo | September 18, 2023

3 Out-of-Favor Utility Stocks With 10-Plus Years of Dividend Raises and High Yields

Surging interest rates have made lower-risk investment options like government bonds and bank CDs more attractive. Most of them offer higher-yielding dividends that they appear likely to continue increasing in the future.

Yahoo | September 17, 2023

3 Low-Beta Dividend Stocks to Reduce Portfolio Volatility

During uncertain times, low-beta dividend stocks can offer stability and safety.

Bob Ciura on InvestorPlace | September 13, 2023

Return Trends At Consolidated Edison (NYSE:ED) Aren't Appealing

Did you know there are some financial metrics that can provide clues of a potential multi-bagger? Firstly, we'd want to...

Yahoo | September 12, 2023

Consolidated Edison (ED): A Balanced Analysis of Its Market Value

Is Consolidated Edison's stock fairly valued? An in-depth exploration of its intrinsic value and financial strength.

Yahoo | September 7, 2023

Read More 'ED' Stories Here

ED Price Returns

1-mo -1.94%
3-mo -1.29%
6-mo -5.32%
1-year -2.03%
3-year 29.96%
5-year 40.88%
YTD -5.08%
2022 15.65%
2021 22.96%
2020 -16.99%
2019 22.54%
2018 -6.62%

ED Dividends

Ex-Dividend Date Type Payout Amount Change
Loading, please wait...
View Full ED Dividend History

Get Free Updates

Join thousands of investors who get the latest news, insights and top rated picks from StockNews.com!