Eastman Chemical Co. (EMN): Price and Financial Metrics

Eastman Chemical Co. (EMN): $92.30

0.00 (0.00%)

POWR Rating

Component Grades

Momentum

D

Stability

C

Sentiment

Quality

C

Add EMN to Watchlist
Sign Up

Industry: Chemicals

Industry

C

Ranked

#10 of 83

in industry

EMN Price/Volume Stats

Current price $92.30 52-week high $93.24
Prev. close $92.30 52-week low $68.89
Day low $91.60 Volume 1,682,800
Day high $92.67 Avg. volume 1,123,202
50-day MA $86.48 Dividend yield 3.55%
200-day MA $82.74 Market Cap 10.83B

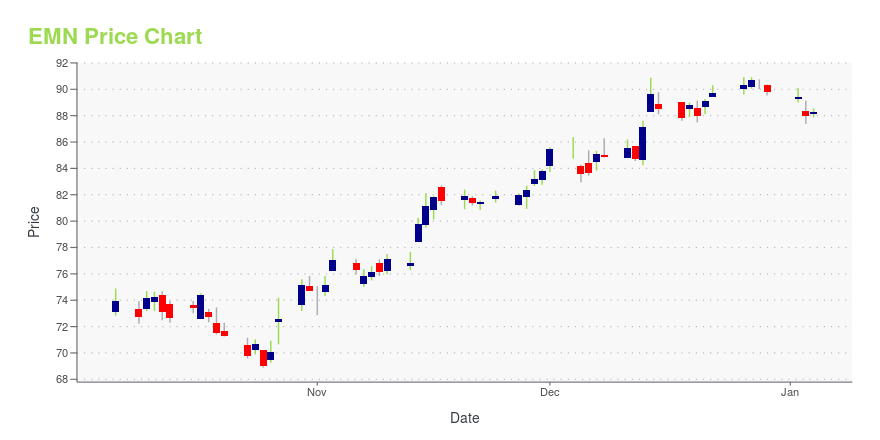
EMN Stock Price Chart Interactive Chart >

EMN POWR Grades

  • EMN scores best on the Value dimension, with a Value rank ahead of 77.45% of US stocks.
  • EMN's strongest trending metric is Growth; it's been moving up over the last 26 weeks.
  • EMN's current lowest rank is in the Momentum metric (where it is better than 19.79% of US stocks).

EMN Stock Summary

  • With a market capitalization of $10,434,818,784, EASTMAN CHEMICAL CO has a greater market value than 83.27% of US stocks.
  • The ratio of debt to operating expenses for EASTMAN CHEMICAL CO is higher than it is for about 83.22% of US stocks.
  • In terms of volatility of its share price, EMN is more volatile than merely 9.04% of stocks we're observing.
  • Stocks that are quantitatively similar to EMN, based on their financial statements, market capitalization, and price volatility, are ENVA, FMC, ITGR, HXL, and TACT.
  • Visit EMN's SEC page to see the company's official filings. To visit the company's web site, go to www.eastman.com.

EMN Valuation Summary

  • In comparison to the median Basic Materials stock, EMN's price/earnings ratio is 8.98% higher, now standing at 18.2.
  • Over the past 243 months, EMN's price/sales ratio has gone up 0.6.

Below are key valuation metrics over time for EMN.

Stock Date P/S P/B P/E EV/EBIT
EMN 2023-12-29 1.1 2 18.2 17.2
EMN 2023-12-28 1.1 2 18.3 17.2
EMN 2023-12-27 1.1 2 18.4 17.3
EMN 2023-12-26 1.1 2 18.3 17.2
EMN 2023-12-22 1.1 2 18.2 17.2
EMN 2023-12-21 1.1 2 18.1 17.1

EMN Growth Metrics

    Its 2 year price growth rate is now at 75.04%.
  • Its 4 year cash and equivalents growth rate is now at 245.18%.
  • Its 5 year net cashflow from operations growth rate is now at 20.86%.
EMN's revenue has moved up $612,000,000 over the prior 15 months.

The table below shows EMN's growth in key financial areas (numbers in millions of US dollars).

Date Revenue Operating Cash Flow Net Income to Common Stock
2022-12-31 10,580 975 793
2022-09-30 10,901 948 1,170
2022-06-30 10,912 1,239 1,220
2022-03-31 10,781 1,420 818
2021-12-31 10,476 1,619 857
2021-09-30 9,968 1,595 511

EMN's Quality Factors

The “Quality” component of the POWR Ratings focuses on 31 different factors of a companies fundamentals and operational strength. Here are some key insights as we drill into the specifics of these quality attributes.
  • EMN has a Quality Grade of C, ranking ahead of 66.58% of graded US stocks.
  • EMN's asset turnover comes in at 0.582 -- ranking 51st of 89 Chemicals stocks.
  • WLK, ASIX, and LYB are the stocks whose asset turnover ratios are most correlated with EMN.

The table below shows EMN's key quality metrics over time.

Period Asset Turnover Gross Margin ROIC
2021-06-30 0.582 0.246 0.049
2021-03-31 0.538 0.231 0.057
2020-12-31 0.525 0.233 0.055
2020-09-30 0.527 0.229 0.054
2020-06-30 0.539 0.232 0.063
2020-03-31 0.563 0.245 0.086

EMN Price Target

For more insight on analysts targets of EMN, see our EMN price target page. And for a list of of all stocks sorted by upside potential based on analyst target price, see our Top Price Target page.

Average Price Target $136.45 Average Broker Recommendation 1.5 (Moderate Buy)

Eastman Chemical Co. (EMN) Company Bio


Eastman Chemical Company is an American company primarily involved in the chemical industry. Once a subsidiary of Kodak, today it is an independent global specialty materials company that produces a broad range of advanced materials, chemicals and fibers for everyday purposes. Founded in 1920 and based in Kingsport, Tennessee, the company now has more than 50 manufacturing sites worldwide and employs approximately 14,000 people. (Source:Wikipedia)


EMN Latest News Stream


Event/Time News Detail
Loading, please wait...

EMN Latest Social Stream


Loading social stream, please wait...

View Full EMN Social Stream

Latest EMN News From Around the Web

Below are the latest news stories about EASTMAN CHEMICAL CO that investors may wish to consider to help them evaluate EMN as an investment opportunity.

Early Retirement Portfolio: 16 Stocks to Live Off Dividends Revisited

In this article, we discuss the best dividend stocks for an early retirement portfolio. You can skip our detailed analysis of dividend stocks and their performance in the past, and go directly to read Early Retirement Portfolio: 5 Stocks to Live Off Dividends Revisited. As investors approach the threshold of retirement, the quest for financial […]

Yahoo | December 28, 2023

Eastman's (EMN) Naia Gets Global Recycled Standard Certification

The GRS certification received by Eastman (EMN) is owned by Textile Exchange, a global non-profit dedicated to long-term transformation in the fashion and textile industries.

Yahoo | December 22, 2023

Eastman Chemical (EMN) Shares Up 13% in 3 Months: Here's Why

Eastman Chemical (EMN) benefits from cost-management actions and innovation and maintains a disciplined approach to capital allocation.

Yahoo | December 18, 2023

Eastman Chemical Co's Dividend Analysis

Eastman Chemical Co (NYSE:EMN) recently announced a dividend of $0.81 per share, payable on 2024-01-05, with the ex-dividend date set for 2023-12-15. As investors look forward to this upcoming payment, the spotlight also shines on the company's dividend history, yield, and growth rates. Using the data from GuruFocus, let's look into Eastman Chemical Co's dividend performance and assess its sustainability.

Yahoo | December 15, 2023

Eastman Chemical (NYSE:EMN) Is Increasing Its Dividend To $0.81

Eastman Chemical Company ( NYSE:EMN ) has announced that it will be increasing its periodic dividend on the 5th of...

Yahoo | December 10, 2023

Read More 'EMN' Stories Here

EMN Price Returns

1-mo 9.30%
3-mo 5.81%
6-mo 22.55%
1-year 18.13%
3-year -8.84%
5-year 38.57%
YTD 3.66%
2023 14.66%
2022 -30.38%
2021 23.54%
2020 31.77%
2019 12.01%

EMN Dividends

Ex-Dividend Date Type Payout Amount Change
Loading, please wait...
View Full EMN Dividend History

Continue Researching EMN

Want to see what other sources are saying about Eastman Chemical Co's financials and stock price? Try the links below:

Eastman Chemical Co (EMN) Stock Price | Nasdaq
Eastman Chemical Co (EMN) Stock Quote, History and News - Yahoo Finance
Eastman Chemical Co (EMN) Stock Price and Basic Information | MarketWatch

Get Free Updates

Join thousands of investors who get the latest news, insights and top rated picks from StockNews.com!