Enzo Biochem, Inc. ($0.01 Par Value) (ENZ): Price and Financial Metrics


Enzo Biochem, Inc. ($0.01 Par Value) (ENZ): $2.51

0.08 (+3.29%)

POWR Rating

Component Grades

Growth

S

Value

I

Momentum

G

Stability

N

Sentiment

U

Quality

P

ENZ Stock Summary

  • ENZ's one year PEG ratio, measuring expected growth in earnings next year relative to current common stock price is 0.01 -- higher than only 0.43% of US-listed equities with positive expected earnings growth.
  • Over the past twelve months, ENZ has reported earnings growth of -41,777.65%, putting it ahead of merely 0.09% of US stocks in our set.
  • As for revenue growth, note that ENZ's revenue has grown -31.36% over the past 12 months; that beats the revenue growth of merely 6.46% of US companies in our set.
  • Stocks with similar financial metrics, market capitalization, and price volatility to ENZO BIOCHEM INC are FATH, OCUL, BZFD, NRDY, and VTRS.
  • ENZ's SEC filings can be seen here. And to visit ENZO BIOCHEM INC's official web site, go to www.enzo.com.

ENZ Valuation Summary

  • In comparison to the median Healthcare stock, ENZ's price/sales ratio is 72.34% lower, now standing at 1.3.
  • Over the past 243 months, ENZ's EV/EBIT ratio has gone down 27.6.

Below are key valuation metrics over time for ENZ.

Stock Date P/S P/B P/E EV/EBIT
ENZ 2023-03-24 1.3 3.3 -3.1 -3.4
ENZ 2023-03-23 1.3 3.2 -3.0 -3.4
ENZ 2023-03-22 1.3 3.1 -2.9 -3.3
ENZ 2023-03-21 1.2 3.1 -2.9 -3.2
ENZ 2023-03-20 1.4 3.4 -3.2 -3.5
ENZ 2023-03-17 1.1 2.4 -4.1 -4.4

ENZ Growth Metrics

    Its year over year cash and equivalents growth rate is now at 106.31%.
  • The 4 year price growth rate now stands at -71.51%.
  • The 3 year revenue growth rate now stands at 31.75%.
Over the past 33 months, ENZ's revenue has gone up $18,654,000.

The table below shows ENZ's growth in key financial areas (numbers in millions of US dollars).

Date Revenue Operating Cash Flow Net Income to Common Stock
2022-09-30 98.828 -19.24 -26.577
2022-06-30 107.071 -16.59 -18.261
2022-03-31 111.6 -7.412 -6.56
2021-12-31 118.175 -4.258 0.3
2021-09-30 115.595 -4.448 5.257
2021-06-30 117.731 0.387 7.875

ENZ's Quality Factors

The “Quality” component of the POWR Ratings focuses on 31 different factors of a companies fundamentals and operational strength. Here are some key insights as we drill into the specifics of these quality attributes.
  • ENZ has a Quality Grade of B, ranking ahead of 78.47% of graded US stocks.
  • ENZ's asset turnover comes in at 1.04 -- ranking 20th of 81 Healthcare stocks.
  • LFMD, RHE, and AHCO are the stocks whose asset turnover ratios are most correlated with ENZ.

The table below shows ENZ's key quality metrics over time.

Period Asset Turnover Gross Margin ROIC
2021-07-31 1.040 0.455 0.105
2021-04-30 0.996 0.459 0.019
2021-01-31 0.850 0.414 -0.189
2020-10-31 0.736 0.355 -0.371
2020-07-31 0.646 0.313 -0.499
2020-04-30 0.666 0.288 -0.621

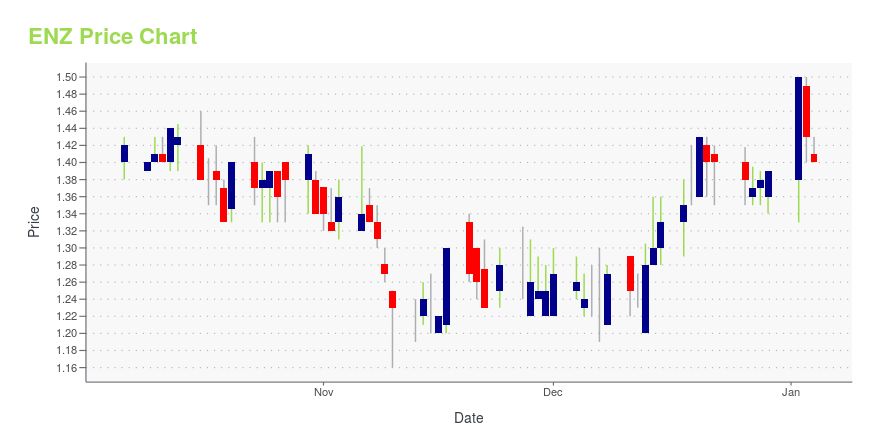
ENZ Stock Price Chart Interactive Chart >

Price chart for ENZ

ENZ Price/Volume Stats

Current price $2.51 52-week high $3.06
Prev. close $2.43 52-week low $1.00
Day low $2.33 Volume 688,900
Day high $2.52 Avg. volume 850,238
50-day MA $1.46 Dividend yield N/A
200-day MA $1.96 Market Cap 124.65M

Enzo Biochem, Inc. ($0.01 Par Value) (ENZ) Company Bio


Enzo Biochem, Inc. engages in the research, development, manufacture, and marketing of diagnostic and research products based on genetic engineering, biotechnology, and molecular biology. The company was founded in 1976 and is based in New York, New York.


ENZ Latest News Stream


Event/Time News Detail
Loading, please wait...

ENZ Latest Social Stream


Loading social stream, please wait...

View Full ENZ Social Stream

Latest ENZ News From Around the Web

Below are the latest news stories about ENZO BIOCHEM INC that investors may wish to consider to help them evaluate ENZ as an investment opportunity.

Enzo Biochem Second Quarter 2023 Earnings: US$0.23 loss per share (vs US$0.055 loss in 2Q 2022)

Enzo Biochem ( NYSE:ENZ ) Second Quarter 2023 Results Key Financial Results Revenue: US$16.3m (down 52% from 2Q 2022...

Yahoo | March 22, 2023

Enzo Biochem Reports Second Quarter Fiscal Year 2023 Financial Results

- Company entered into an Asset Purchase Agreement for substantially all of the operating assets of the Clinical Labs division - Enzo Life Sciences reports revenue of $7.5 million, with Jan-23 revenue of $3.6M as the second highest monthly revenue in over 10 years FARMINGDALE, NY, March 21, 2023 (GLOBE NEWSWIRE) -- Enzo Biochem, Inc. (NYSE:ENZ), a pioneering biosciences and diagnostics company, filed its Form 10-Q for the second quarter ended January 31, 2023 of Fiscal Year 2023 (Q2 FY23). Enzo

Yahoo | March 21, 2023

Following a 26% decline over last year, recent gains may please Enzo Biochem, Inc. (NYSE:ENZ) institutional owners

Key Insights Institutions' substantial holdings in Enzo Biochem implies that they have significant influence over the...

Yahoo | March 18, 2023

Today’s Biggest Pre-Market Stock Movers: 10 Top Gainers and Losers on Friday

The biggest pre-market stock movers for Friday are ready to go as we dive into the latest news for investors this morning!

William White on InvestorPlace | March 17, 2023

Why Is Enzo Biochem (ENZ) Stock Up 72% Today?

Enzo Biochem (ENZ) stock is rocketing higher on Friday with heavy trading after the company agreed to an asset sale with Labcorp (LH).

William White on InvestorPlace | March 17, 2023

Read More 'ENZ' Stories Here

ENZ Price Returns

1-mo 122.12%
3-mo 75.52%
6-mo 12.56%
1-year -14.63%
3-year 0.40%
5-year -54.20%
YTD 75.52%
2022 -55.45%
2021 27.38%
2020 -4.18%
2019 -5.40%
2018 -65.89%

Get Free Updates

Join thousands of investors who get the latest news, insights and top rated picks from StockNews.com!


Page generated in 0.9227 seconds.