Enerplus Corporation (ERF): Price and Financial Metrics
ERF Price/Volume Stats
Current price | $15.95 | 52-week high | $18.74 |
Prev. close | $15.86 | 52-week low | $12.84 |
Day low | $15.82 | Volume | 1,050,100 |
Day high | $16.19 | Avg. volume | 1,165,684 |
50-day MA | $16.78 | Dividend yield | 1.51% |
200-day MA | $15.74 | Market Cap | 3.28B |
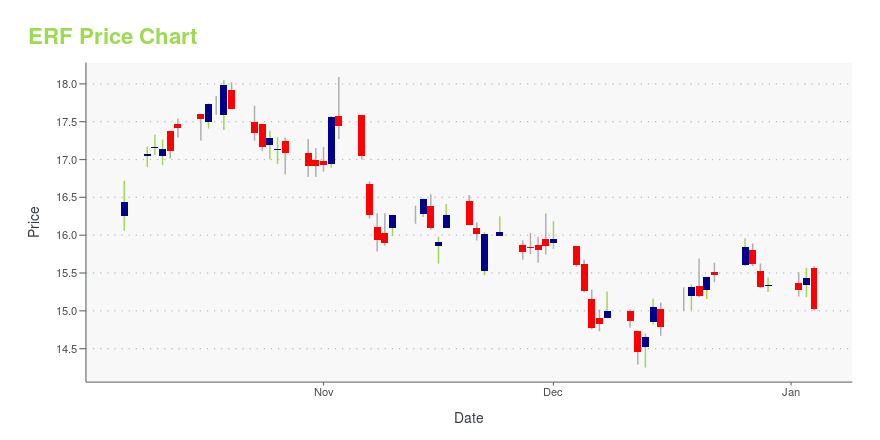
ERF Stock Price Chart Interactive Chart >
ERF POWR Grades
- Quality is the dimension where ERF ranks best; there it ranks ahead of 95.25% of US stocks.
- The strongest trend for ERF is in Value, which has been heading down over the past 177 days.
- ERF ranks lowest in Growth; there it ranks in the 7th percentile.
ERF Stock Summary
- ERF's current price/earnings ratio is 5.05, which is higher than merely 7.05% of US stocks with positive earnings.
- With a year-over-year growth in debt of -38.31%, ENERPLUS CORP's debt growth rate surpasses only 8.26% of about US stocks.
- ENERPLUS CORP's shareholder yield -- a measure of how much capital is returned to stockholders via dividends and buybacks -- is 15.93%, greater than the shareholder yield of 87.98% of stocks in our set.
- Stocks with similar financial metrics, market capitalization, and price volatility to ENERPLUS CORP are ML, NE, HCC, AMPY, and CEIX.
- Visit ERF's SEC page to see the company's official filings. To visit the company's web site, go to www.enerplus.com.
ERF Valuation Summary
- In comparison to the median Energy stock, ERF's price/earnings ratio is 42.53% lower, now standing at 5.
- Over the past 243 months, ERF's price/sales ratio has gone down 2.9.
Below are key valuation metrics over time for ERF.
Stock | Date | P/S | P/B | P/E | EV/EBIT |
---|---|---|---|---|---|
ERF | 2023-11-10 | 1.9 | 2.8 | 5.0 | 4.1 |
ERF | 2023-11-09 | 1.8 | 2.7 | 4.9 | 4.0 |
ERF | 2023-11-08 | 1.8 | 2.7 | 4.9 | 4.0 |
ERF | 2023-11-07 | 1.9 | 2.8 | 5.1 | 4.1 |
ERF | 2023-11-06 | 2.0 | 2.9 | 5.3 | 4.3 |
ERF | 2023-11-03 | 2.0 | 3.0 | 5.4 | 4.4 |
ERF Growth Metrics
- Its 4 year price growth rate is now at -64.46%.
- The 5 year net cashflow from operations growth rate now stands at 91.12%.
- Its 2 year cash and equivalents growth rate is now at -78.67%.

The table below shows ERF's growth in key financial areas (numbers in millions of US dollars).
Date | Revenue | Operating Cash Flow | Net Income to Common Stock |
---|---|---|---|
2022-12-31 | 2,155.688 | 1,173.382 | 914.302 |
2022-09-30 | 2,154.061 | 1,161.05 | 767.7535 |
2022-09-30 | 2,154.061 | 1,161.05 | 767.7535 |
2022-06-30 | 1,772.739 | 921.0852 | 545.8152 |
2022-06-30 | 1,772.739 | 921.0852 | 545.8152 |
2022-03-31 | 1,350.266 | 772.9017 | 256.6612 |
ERF Price Target
For more insight on analysts targets of ERF, see our ERF price target page. And for a list of of all stocks sorted by upside potential based on analyst target price, see our Top Price Target page.
Average Price Target | $9.96 | Average Broker Recommendation | 1.5 (Moderate Buy) |
Enerplus Corporation (ERF) Company Bio
Enerplus Corporation engages in the exploration and development of crude oil and natural gas in the United States and Canada. The company was founded in 1986 and is based in Calgary, Canada.
Latest ERF News From Around the Web
Below are the latest news stories about ENERPLUS CORP that investors may wish to consider to help them evaluate ERF as an investment opportunity.
Chesapeake Investor Would Support a Deal to Buy Southwestern(Bloomberg) -- Kimmeridge Energy Management Co., which is among the most active and outspoken US oil and gas investors, said a merger of Chesapeake Energy Corp. and Southwestern Energy Co. would create one of the industry’s most sought-after stocks. Most Read from BloombergCitigroup Cuts Over 300 Senior Manager Roles in Latest RestructuringNearly All of OpenAI Staff Threaten to Go to Microsoft If Board Doesn’t QuitThe Doomed Mission Behind Sam Altman’s Shock Ouster From OpenAIMicrosoft Ends Week |
The Trend Of High Returns At Enerplus (TSE:ERF) Has Us Very InterestedIf we want to find a stock that could multiply over the long term, what are the underlying trends we should look for... |
Enerplus Corporation (NYSE:ERF) Q3 2023 Earnings Call TranscriptEnerplus Corporation (NYSE:ERF) Q3 2023 Earnings Call Transcript November 3, 2023 Operator: Good morning, ladies and gentlemen, and welcome to the Enerplus Q3 2023 Results Conference Call. At this time, all lines are in a listen-only mode. But following the presentation we will conduct a question-and-answer session. [Operator Instructions]. Also note that this call is […] |
Enerplus Announces December Quarterly DividendEnerplus Corp.’s quarterly dividend of US$0.06 per share is payable on Dec. 15. |
7 Value Stocks to Buy While They Are Still Out of the LimelightAlthough 2023 has witnessed a massive surge in relevant industries – most notably artificial intelligence – investors may want to consider value stocks to buy at the current juncture. |
ERF Price Returns
1-mo | -8.20% |
3-mo | N/A |
6-mo | 9.69% |
1-year | -10.79% |
3-year | 508.64% |
5-year | 79.72% |
YTD | -8.31% |
2022 | 68.78% |
2021 | 240.91% |
2020 | -54.46% |
2019 | -6.97% |
2018 | -20.04% |
ERF Dividends
Ex-Dividend Date | Type | Payout Amount | Change | ||||||
---|---|---|---|---|---|---|---|---|---|
Loading, please wait... |
Continue Researching ERF
Want to do more research on ENERPLUS Corp's stock and its price? Try the links below:ENERPLUS Corp (ERF) Stock Price | Nasdaq
ENERPLUS Corp (ERF) Stock Quote, History and News - Yahoo Finance
ENERPLUS Corp (ERF) Stock Price and Basic Information | MarketWatch
Loading social stream, please wait...