Ford Motor Co. (F): Price and Financial Metrics
GET POWR RATINGS... FREE!
F POWR Grades
- F scores best on the Growth dimension, with a Growth rank ahead of 99.15% of US stocks.
- F's strongest trending metric is Quality; it's been moving down over the last 178 days.
- F's current lowest rank is in the Stability metric (where it is better than 21.06% of US stocks).
F Stock Summary
- F has a higher market value than 95.27% of US stocks; more precisely, its current market capitalization is $45,428,683,953.
- FORD MOTOR CO's stock had its IPO on January 1, 1986, making it an older stock than 93.42% of US equities in our set.
- The ratio of debt to operating expenses for FORD MOTOR CO is higher than it is for about 94.28% of US stocks.
- Stocks with similar financial metrics, market capitalization, and price volatility to FORD MOTOR CO are GM, UBS, PH, MGM, and VOD.
- F's SEC filings can be seen here. And to visit FORD MOTOR CO's official web site, go to www.ford.com.
F Valuation Summary
- In comparison to the median Consumer Cyclical stock, F's EV/EBIT ratio is 870.45% lower, now standing at -101.7.
- Over the past 243 months, F's price/sales ratio has gone up 0.2.
Below are key valuation metrics over time for F.
Stock | Date | P/S | P/B | P/E | EV/EBIT |
---|---|---|---|---|---|
F | 2023-03-16 | 0.3 | 1.1 | -24.0 | -101.7 |
F | 2023-03-15 | 0.3 | 1.1 | -23.8 | -101.5 |
F | 2023-03-14 | 0.3 | 1.1 | -24.2 | -102.0 |
F | 2023-03-13 | 0.3 | 1.1 | -24.4 | -102.3 |
F | 2023-03-10 | 0.3 | 1.1 | -24.6 | -102.4 |
F | 2023-03-09 | 0.3 | 1.2 | -25.3 | -103.3 |
F Growth Metrics
- Its year over year revenue growth rate is now at 4.29%.
- The 2 year price growth rate now stands at 177.95%.
- Its 5 year revenue growth rate is now at -2.19%.

The table below shows F's growth in key financial areas (numbers in millions of US dollars).
Date | Revenue | Operating Cash Flow | Net Income to Common Stock |
---|---|---|---|
2022-12-31 | 158,057 | 6,853 | -1,981 |
2022-09-30 | 151,736 | 9,206 | 9,012 |
2022-06-30 | 148,027 | 12,402 | 11,671 |
2022-03-31 | 134,589 | 10,211 | 11,565 |
2021-12-31 | 136,341 | 15,787 | 17,937 |
2021-09-30 | 134,615 | 16,795 | 2,867 |
F's Quality Factors
The “Quality” component of the POWR Ratings focuses on 31 different factors of a companies fundamentals and operational strength. Here are some key insights as we drill into the specifics of these quality attributes.- F has a Quality Grade of C, ranking ahead of 36.55% of graded US stocks.
- F's asset turnover comes in at 0.523 -- ranking 46th of 68 Automobiles and Trucks stocks.
- SRI, PCAR, and BWA are the stocks whose asset turnover ratios are most correlated with F.
The table below shows F's key quality metrics over time.
Period | Asset Turnover | Gross Margin | ROIC |
---|---|---|---|
2021-09-30 | 0.523 | 0.101 | 0.016 |
2021-06-30 | 0.526 | 0.102 | 0.019 |
2021-03-31 | 0.488 | 0.079 | 0.019 |
2020-12-31 | 0.479 | 0.045 | 0.002 |
2020-09-30 | 0.498 | 0.055 | 0.005 |
2020-06-30 | 0.497 | 0.038 | -0.004 |
F Price Target
For more insight on analysts targets of F, see our F price target page. And for a list of of all stocks sorted by upside potential based on analyst target price, see our Top Price Target page.
Average Price Target | $15.41 | Average Broker Recommendation | 1.71 (Moderate Buy) |
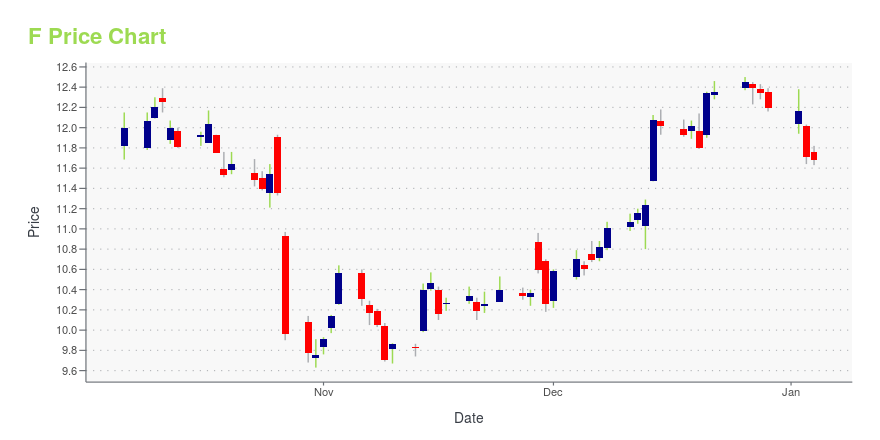
F Stock Price Chart Interactive Chart >
F Price/Volume Stats
Current price | $11.72 | 52-week high | $17.80 |
Prev. close | $11.18 | 52-week low | $10.61 |
Day low | $11.38 | Volume | 74,386,550 |
Day high | $11.78 | Avg. volume | 70,293,016 |
50-day MA | $12.67 | Dividend yield | 5.31% |
200-day MA | $13.09 | Market Cap | 46.72B |
Ford Motor Co. (F) Company Bio
Ford Motor Company (commonly known as Ford) is an American multinational automobile manufacturer headquartered in Dearborn, Michigan, United States. It was founded by Henry Ford and incorporated on June 16, 1903. The company sells automobiles and commercial vehicles under the Ford brand, and luxury cars under its Lincoln luxury brand. Ford also owns Brazilian SUV manufacturer Troller, an 8% stake in Aston Martin of the United Kingdom and a 32% stake in China’s Jiangling Motors. It also has joint-ventures in China (Changan Ford), Taiwan (Ford Lio Ho), Thailand (AutoAlliance Thailand), Turkey (Ford Otosan), and Russia (Ford Sollers). The company is listed on the New York Stock Exchange and is controlled by the Ford family; they have minority ownership but the majority of the voting power. (Source:Wikipedia)
Latest F News From Around the Web
Below are the latest news stories about FORD MOTOR CO that investors may wish to consider to help them evaluate F as an investment opportunity.
Ford Motor Company (F) Stock Sinks As Market Gains: What You Should KnowIn the latest trading session, Ford Motor Company (F) closed at $11.18, marking a -1.06% move from the previous day. |
Ford (F) to Recall 1.5M Vehicles Over Brake and Wiper IssuesFord (F) to call back Ford Fusions and Lincoln MKZs to fix leaky brake hoses and F-150 to inspect and replace faulty windshield wiper arms. |
Auto Roundup: LAD Expands UK Presence, WPRT Incurs Q4 Loss & MoreWhile Lithia's (LAD) buyout of Jardine bolsters its opportunities in the U.K. market, Westport (WPRT) posts disappointing Q4 results with a wider-than-expected loss. |
Is Ford Motor (NYSE:F) A Risky Investment?Some say volatility, rather than debt, is the best way to think about risk as an investor, but Warren Buffett famously... |
Elon Musk’s Cost-Cutting Targets at Tesla Pressure EV RivalsCar makers trying to catch up to Tesla electric vehicles were thrown a curveball recently with Elon Musk’s latest goal: slashing the cost of building next-generation cars by 50% in coming years. Analysts already estimate Tesla’s bestselling vehicles enjoy thousands of dollars in cost advantages over rivals in producing EVs, and those competitors have been trying to close the gap. “There is a clear path to making a…smaller vehicle that is roughly half the production cost and difficulty of our Model 3,” Mr. Musk said earlier this month during a Morgan Stanley conference. |
F Price Returns
1-mo | -9.08% |
3-mo | 5.76% |
6-mo | -1.42% |
1-year | -22.33% |
3-year | 198.61% |
5-year | 36.46% |
YTD | 7.13% |
2022 | -42.18% |
2021 | 137.48% |
2020 | -3.88% |
2019 | 29.64% |
2018 | -34.35% |
F Dividends
Ex-Dividend Date | Type | Payout Amount | Change | ||||||
---|---|---|---|---|---|---|---|---|---|
Loading, please wait... |
Continue Researching F
Want to see what other sources are saying about Ford Motor Co's financials and stock price? Try the links below:Ford Motor Co (F) Stock Price | Nasdaq
Ford Motor Co (F) Stock Quote, History and News - Yahoo Finance
Ford Motor Co (F) Stock Price and Basic Information | MarketWatch
Loading social stream, please wait...