
FB Financial Corporation (FBK): Price and Financial Metrics
FBK Price/Volume Stats
| Current price | $47.24 | 52-week high | $48.30 |
| Prev. close | $47.07 | 52-week low | $27.42 |
| Day low | $46.78 | Volume | 189,787 |
| Day high | $47.86 | Avg. volume | 146,259 |
| 50-day MA | $39.26 | Dividend yield | 1.44% |
| 200-day MA | $36.53 | Market Cap | 2.22B |
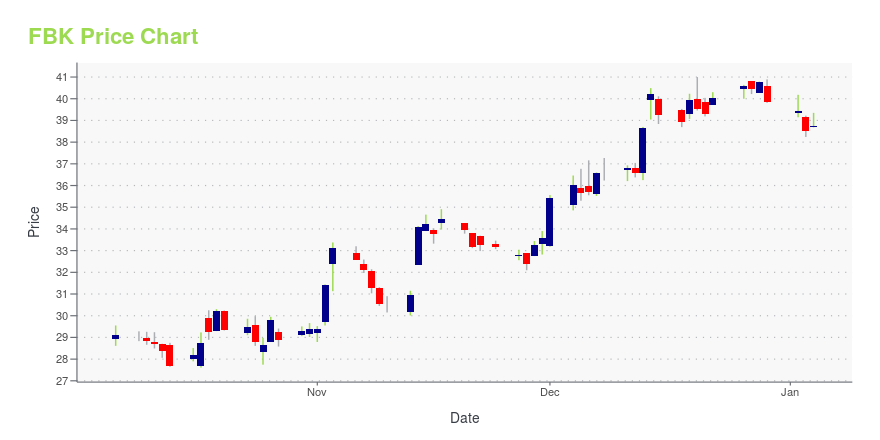
FBK Stock Price Chart Interactive Chart >
FB Financial Corporation (FBK) Company Bio
FB Financial is a Tennessee bank with 45 branches and $3 billion in assets. The company was founded in 1906 and is based in Nashville, Tennessee.
Latest FBK News From Around the Web
Below are the latest news stories about FB FINANCIAL CORP that investors may wish to consider to help them evaluate FBK as an investment opportunity.
Take the Zacks Approach to Beat the Market: Shopify, Fastenal, Block in FocusLast week, our time-tested methodologies served investors well in navigating the market. Check out some of our achievements from the past three months. |
Despite the downward trend in earnings at FB Financial (NYSE:FBK) the stock ascends 8.3%, bringing five-year gains to 23%If you buy and hold a stock for many years, you'd hope to be making a profit. Furthermore, you'd generally like to see... |
Should You Buy FB Financial Corporation (NYSE:FBK) For Its Upcoming Dividend?FB Financial Corporation ( NYSE:FBK ) stock is about to trade ex-dividend in three days. The ex-dividend date is one... |
FB Financial Corporation Declares Regular Quarterly DividendNASHVILLE, Tenn., October 27, 2023--FB Financial Corporation (NYSE: FBK) announced today that its board of directors declared a quarterly cash dividend of $0.15 per share. The dividend is payable on November 21, 2023, to shareholders of record as of November 7, 2023. |
FB Financial Corporation (NYSE:FBK) Q3 2023 Earnings Call TranscriptFB Financial Corporation (NYSE:FBK) Q3 2023 Earnings Call Transcript October 17, 2023 Operator: Good morning and welcome to the FB Financial Corporation’s Third Quarter 2023 Earnings Conference Call. Hosting the call today from FB Financial are Chris Holmes, President and Chief Executive Officer; and Michael Mettee, Chief Financial Officer. Also joining the call for the […] |
FBK Price Returns
| 1-mo | 27.19% |
| 3-mo | 25.19% |
| 6-mo | 23.91% |
| 1-year | 39.33% |
| 3-year | 30.74% |
| 5-year | 31.59% |
| YTD | 19.62% |
| 2023 | 12.32% |
| 2022 | -16.50% |
| 2021 | 27.53% |
| 2020 | -11.14% |
| 2019 | 14.04% |
FBK Dividends
| Ex-Dividend Date | Type | Payout Amount | Change | ||||||
|---|---|---|---|---|---|---|---|---|---|
| Loading, please wait... | |||||||||
Continue Researching FBK
Here are a few links from around the web to help you further your research on FB Financial Corp's stock as an investment opportunity:FB Financial Corp (FBK) Stock Price | Nasdaq
FB Financial Corp (FBK) Stock Quote, History and News - Yahoo Finance
FB Financial Corp (FBK) Stock Price and Basic Information | MarketWatch
Loading social stream, please wait...