Flushing Financial Corporation (FFIC): Price and Financial Metrics
GET POWR RATINGS... FREE!
FFIC POWR Grades
- Momentum is the dimension where FFIC ranks best; there it ranks ahead of 81.87% of US stocks.
- The strongest trend for FFIC is in Growth, which has been heading down over the past 177 days.
- FFIC's current lowest rank is in the Growth metric (where it is better than 8.3% of US stocks).
FFIC Stock Summary
- For FFIC, its debt to operating expenses ratio is greater than that reported by 88.6% of US equities we're observing.
- Equity multiplier, or assets relative to shareholders' equity, comes in at 12.43 for FLUSHING FINANCIAL CORP; that's greater than it is for 94.49% of US stocks.
- FLUSHING FINANCIAL CORP's shareholder yield -- a measure of how much capital is returned to stockholders via dividends and buybacks -- is -42.84%, greater than the shareholder yield of only 12.24% of stocks in our set.
- Stocks that are quantitatively similar to FFIC, based on their financial statements, market capitalization, and price volatility, are CNOB, HNVR, OCFC, FLIC, and PROV.
- Visit FFIC's SEC page to see the company's official filings. To visit the company's web site, go to www.flushingbank.com.
FFIC Valuation Summary
- In comparison to the median Financial Services stock, FFIC's price/earnings ratio is 38.95% lower, now standing at 5.8.
- Over the past 243 months, FFIC's EV/EBIT ratio has gone down 14.7.
Below are key valuation metrics over time for FFIC.
Stock | Date | P/S | P/B | P/E | EV/EBIT |
---|---|---|---|---|---|
FFIC | 2023-03-17 | 1.8 | 0.7 | 5.8 | 13.3 |
FFIC | 2023-03-16 | 2.0 | 0.7 | 6.3 | 13.7 |
FFIC | 2023-03-15 | 1.9 | 0.7 | 6.1 | 13.5 |
FFIC | 2023-03-14 | 1.8 | 0.7 | 6.0 | 13.4 |
FFIC | 2023-03-13 | 1.8 | 0.7 | 5.5 | 16.7 |
FFIC | 2023-03-10 | 1.9 | 0.7 | 5.9 | 17.0 |
FFIC Growth Metrics
- Its 2 year net income to common stockholders growth rate is now at 146.71%.
- Its 4 year cash and equivalents growth rate is now at 206.91%.
- Its 3 year revenue growth rate is now at 47.53%.

The table below shows FFIC's growth in key financial areas (numbers in millions of US dollars).
Date | Revenue | Operating Cash Flow | Net Income to Common Stock |
---|---|---|---|
2022-09-30 | 263.616 | 93.68 | 84.779 |
2022-06-30 | 266.717 | 97.265 | 86.75 |
2022-03-31 | 255.651 | 119.606 | 80.973 |
2021-12-31 | 256.6 | 88.598 | 81.793 |
2021-09-30 | 245.656 | 85.383 | 67.171 |
2021-06-30 | 223.304 | 77.36 | 56.089 |
FFIC's Quality Factors
The “Quality” component of the POWR Ratings focuses on 31 different factors of a companies fundamentals and operational strength. Here are some key insights as we drill into the specifics of these quality attributes.- FFIC has a Quality Grade of C, ranking ahead of 26.4% of graded US stocks.
- FFIC's asset turnover comes in at 0.028 -- ranking 398th of 428 Banking stocks.
- MVBF, IBCP, and CASH are the stocks whose asset turnover ratios are most correlated with FFIC.
The table below shows FFIC's key quality metrics over time.
Period | Asset Turnover | Gross Margin | ROIC |
---|---|---|---|
2021-06-30 | 0.028 | 1 | 0.008 |
2021-03-31 | 0.029 | 1 | 0.008 |
2020-12-31 | 0.025 | 1 | 0.005 |
2020-09-30 | 0.025 | 1 | 0.007 |
2020-06-30 | 0.024 | 1 | 0.006 |
2020-03-31 | 0.022 | 1 | 0.005 |
FFIC Price Target
For more insight on analysts targets of FFIC, see our FFIC price target page. And for a list of of all stocks sorted by upside potential based on analyst target price, see our Top Price Target page.
Average Price Target | $26.38 | Average Broker Recommendation | 1.75 (Moderate Buy) |
FFIC Stock Price Chart Interactive Chart >
FFIC Price/Volume Stats
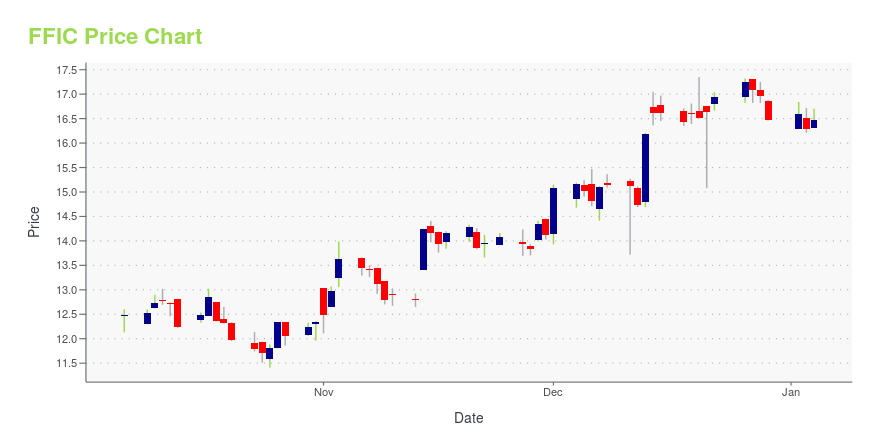
Current price | $14.76 | 52-week high | $23.59 |
Prev. close | $14.53 | 52-week low | $13.92 |
Day low | $14.55 | Volume | 23,590 |
Day high | $15.16 | Avg. volume | 181,602 |
50-day MA | $18.14 | Dividend yield | 5.9% |
200-day MA | $20.07 | Market Cap | 435.24M |
Flushing Financial Corporation (FFIC) Company Bio
Flushing Financial provides banking products and services primarily to consumers and businesses in New York. was founded in 1995 and is based in Lake Success, New York.
Latest FFIC News From Around the Web
Below are the latest news stories about FLUSHING FINANCIAL CORP that investors may wish to consider to help them evaluate FFIC as an investment opportunity.
Flushing Financial Corporation To Host First Quarter 2023 Earnings CallUNIONDALE, N.Y., March 22, 2023 (GLOBE NEWSWIRE) -- Flushing Financial Corporation (the “Company”) (Nasdaq-GS: FFIC), the parent holding company for Flushing Bank (the “Bank”), today announced that it will release its first quarter 2023 earnings after the market closes on April 25, 2023. John R. Buran, President and Chief Executive Officer, and Susan K. Cullen, Senior Executive Vice President, Chief Financial Officer and Treasurer, will host the conference call on Wednesday, April 26, 2023, at 9 |
Insiders Are Doubling Down on These 8 Bank StocksInsiders of bank stocks have stepped up purchases in their respective companies following the collapse of Silicon Valley Bank. |
Flushing Bank attends Manhattan Neighborhood Network (MNN) Ribbon CuttingUNIONDALE, N.Y., March 16, 2023 (GLOBE NEWSWIRE) -- Flushing Financial Corporation (the “Company”) (Nasdaq: FFIC), the parent holding company for Flushing Bank (the “Bank”), attended the Manhattan Neighborhood Network Ribbon Cutting on March 15, 2023. This event marks the completion of the new office space located at 509 West 38th Street. Members of the bank’s management team along with City Council Members Shaun Abreu and Erik Bottcher, Manhattan Borough President Mark Levine and the Honorable |
New York Community Bancorp (NYCB) Moves 7.6% Higher: Will This Strength Last?New York Community Bancorp (NYCB) saw its shares surge in the last session with trading volume being higher than average. The latest trend in earnings estimate revisions may not translate into further price increase in the near term. |
Flushing Financial Corporation (NASDAQ:FFIC) Looks Interesting, And It's About To Pay A DividendSome investors rely on dividends for growing their wealth, and if you're one of those dividend sleuths, you might be... |
FFIC Price Returns
1-mo | -22.64% |
3-mo | -22.92% |
6-mo | -22.02% |
1-year | -31.03% |
3-year | 26.61% |
5-year | -32.22% |
YTD | -22.92% |
2022 | -16.91% |
2021 | 51.31% |
2020 | -18.10% |
2019 | 4.39% |
2018 | -19.22% |
FFIC Dividends
Ex-Dividend Date | Type | Payout Amount | Change | ||||||
---|---|---|---|---|---|---|---|---|---|
Loading, please wait... |
Continue Researching FFIC
Want to do more research on Flushing Financial Corp's stock and its price? Try the links below:Flushing Financial Corp (FFIC) Stock Price | Nasdaq
Flushing Financial Corp (FFIC) Stock Quote, History and News - Yahoo Finance
Flushing Financial Corp (FFIC) Stock Price and Basic Information | MarketWatch
Loading social stream, please wait...