Foot Locker, Inc. (FL): Price and Financial Metrics
FL Price/Volume Stats
Current price | $28.19 | 52-week high | $47.22 |
Prev. close | $28.35 | 52-week low | $14.84 |
Day low | $27.88 | Volume | 2,247,400 |
Day high | $28.44 | Avg. volume | 3,838,000 |
50-day MA | $22.22 | Dividend yield | 5.66% |
200-day MA | $28.48 | Market Cap | 2.65B |
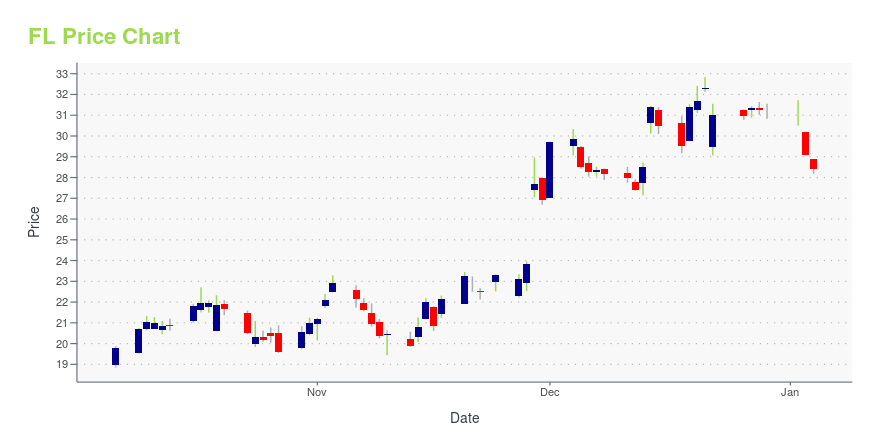
FL Stock Price Chart Interactive Chart >
FL POWR Grades
- Value is the dimension where FL ranks best; there it ranks ahead of 62.58% of US stocks.
- The strongest trend for FL is in Quality, which has been heading down over the past 177 days.
- FL's current lowest rank is in the Stability metric (where it is better than 13.91% of US stocks).
FL Stock Summary
- FOOT LOCKER INC's stock had its IPO on January 1, 1986, making it an older stock than 93.02% of US equities in our set.
- The price/operating cash flow metric for FOOT LOCKER INC is higher than 87.09% of stocks in our set with a positive cash flow.
- FL's price/sales ratio is 0.34; that's higher than the P/S ratio of merely 11.77% of US stocks.
- If you're looking for stocks that are quantitatively similar to FOOT LOCKER INC, a group of peers worth examining would be BCC, LPX, AEO, AMN, and RMR.
- Visit FL's SEC page to see the company's official filings. To visit the company's web site, go to www.footlocker-inc.com.
FL Valuation Summary
- FL's price/sales ratio is 0.3; this is 83.33% lower than that of the median Consumer Cyclical stock.
- Over the past 243 months, FL's price/sales ratio has gone down 0.4.
Below are key valuation metrics over time for FL.
Stock | Date | P/S | P/B | P/E | EV/EBIT |
---|---|---|---|---|---|
FL | 2023-12-01 | 0.3 | 0.9 | 19.2 | 22.4 |
FL | 2023-11-30 | 0.3 | 0.8 | 17.4 | 21.4 |
FL | 2023-11-29 | 0.3 | 0.8 | 17.8 | 21.7 |
FL | 2023-11-28 | 0.3 | 0.7 | 15.4 | 20.2 |
FL | 2023-11-27 | 0.3 | 0.7 | 14.9 | 20.0 |
FL | 2023-11-24 | 0.3 | 0.7 | 15.0 | 20.0 |
FL Growth Metrics
- Its 5 year cash and equivalents growth rate is now at -3.53%.
- Its 5 year price growth rate is now at -41.1%.
- Its 3 year net cashflow from operations growth rate is now at -63.89%.

The table below shows FL's growth in key financial areas (numbers in millions of US dollars).
Date | Revenue | Operating Cash Flow | Net Income to Common Stock |
---|---|---|---|
2022-09-30 | 8,754 | 136 | 426 |
2022-06-30 | 8,770 | 162 | 488 |
2022-03-31 | 8,980 | 247 | 824 |
2021-12-31 | 8,958 | 666 | 893 |
2021-09-30 | 8,806 | 888 | 913 |
2021-06-30 | 8,723 | 858 | 1,020 |
FL's Quality Factors
The “Quality” component of the POWR Ratings focuses on 31 different factors of a companies fundamentals and operational strength. Here are some key insights as we drill into the specifics of these quality attributes.- FL has a Quality Grade of C, ranking ahead of 72.98% of graded US stocks.
- FL's asset turnover comes in at 1.2 -- ranking 116th of 165 Retail stocks.
- GPS, AEO, and ZUMZ are the stocks whose asset turnover ratios are most correlated with FL.
The table below shows FL's key quality metrics over time.
Period | Asset Turnover | Gross Margin | ROIC |
---|---|---|---|
2021-07-31 | 1.200 | 0.335 | 0.206 |
2021-05-01 | 1.200 | 0.312 | 0.130 |
2021-01-30 | 1.087 | 0.289 | 0.070 |
2020-10-31 | 1.110 | 0.285 | 0.071 |
2020-08-01 | 1.101 | 0.287 | 0.042 |
2020-05-02 | 1.063 | 0.299 | 0.043 |
FL Price Target
For more insight on analysts targets of FL, see our FL price target page. And for a list of of all stocks sorted by upside potential based on analyst target price, see our Top Price Target page.
Average Price Target | $75.79 | Average Broker Recommendation | 1.61 (Moderate Buy) |
Foot Locker, Inc. (FL) Company Bio
Foot Locker operates as an athletic shoes and apparel retailer. The company operates in two segments, Athletic Stores and Direct-to-Customers. The company was founded in 1879 and is based in New York, New York.
Latest FL News From Around the Web
Below are the latest news stories about FOOT LOCKER INC that investors may wish to consider to help them evaluate FL as an investment opportunity.
Foot Locker (FL) Gains From Digital Business Strength Amid RisksFoot Locker (FL) has been benefiting from strength in its digital business, growth investments and FLX membership program. However, a challenging retail landscape has been impacting its results. |
The Stocks Investors Are Putting Under the TreeShares of retailers including Victoria’s Secret and Foot Locker are surging despite mixed holiday updates. |
Foot Locker, Inc.'s (NYSE:FL) Stock is Soaring But Financials Seem Inconsistent: Will The Uptrend Continue?Most readers would already be aware that Foot Locker's (NYSE:FL) stock increased significantly by 50% over the past... |
RPT-WRAPUP 1-Once-gloomy US retailers now signaling more holiday cheer after solid start to seasonRetailers like Amazon.com and Foot Locker are signaling optimism for holiday season sales after stronger-than-expected figures during Black Friday and Cyber Monday, as heavy discounts lured budget-strained customers on the peak U.S. shopping days. Early estimates on holiday shopping have been encouraging to some investors after retailers sounded cautious notes in the lead-up to the season. Online sales in the U.S. during the five-day period from Thanksgiving through Cyber Monday hit a record $38 billion, according to Adobe Analytics, while the National Retail Federation said more than 200 million people shopped both in-store and online during the holiday weekend, surpassing estimates. |
Once-gloomy US retailers now signaling more holiday cheer after solid start to season(Reuters) -Retailers like Amazon.com and Foot Locker are signaling optimism for holiday season sales after stronger-than-expected figures during Black Friday and Cyber Monday, as heavy discounts lured budget-strained customers on the peak U.S. shopping days. Early estimates on holiday shopping have been encouraging to some investors after retailers sounded cautious notes in the lead-up to the season. Online sales in the U.S. during the five-day period from Thanksgiving through Cyber Monday hit a record $38 billion, according to Adobe Analytics, while the National Retail Federation said more than 200 million people shopped both in-store and online during the holiday weekend, surpassing estimates. |
FL Price Returns
1-mo | 38.53% |
3-mo | 58.42% |
6-mo | 9.16% |
1-year | -21.49% |
3-year | -26.03% |
5-year | -35.59% |
YTD | -21.19% |
2022 | -9.01% |
2021 | 9.66% |
2020 | 7.07% |
2019 | -24.48% |
2018 | 16.73% |
FL Dividends
Ex-Dividend Date | Type | Payout Amount | Change | ||||||
---|---|---|---|---|---|---|---|---|---|
Loading, please wait... |
Continue Researching FL
Want to do more research on Foot Locker Inc's stock and its price? Try the links below:Foot Locker Inc (FL) Stock Price | Nasdaq
Foot Locker Inc (FL) Stock Quote, History and News - Yahoo Finance
Foot Locker Inc (FL) Stock Price and Basic Information | MarketWatch
Loading social stream, please wait...