
Farmers & Merchants Bancorp, Inc. (FMAO): Price and Financial Metrics
FMAO Price/Volume Stats
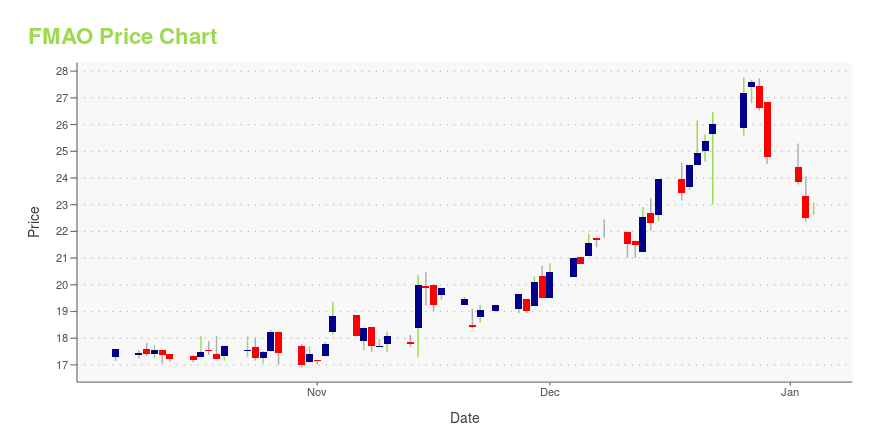
| Current price | $28.09 | 52-week high | $28.75 |
| Prev. close | $28.21 | 52-week low | $16.90 |
| Day low | $27.41 | Volume | 62,964 |
| Day high | $28.75 | Avg. volume | 26,773 |
| 50-day MA | $22.94 | Dividend yield | 3.14% |
| 200-day MA | $21.44 | Market Cap | 384.33M |
FMAO Stock Price Chart Interactive Chart >
Farmers & Merchants Bancorp, Inc. (FMAO) Company Bio
Farmers & Merchants Bancorp, Inc. operates as a bank holding company for The Farmers & Merchants State Bank that provides commercial banking, retail banking, and other financial services to individuals and small businesses in Northwest Ohio and Northeast Indiana. The company was founded in 1897 and is based in Archbold, Ohio.
Latest FMAO News From Around the Web
Below are the latest news stories about FARMERS & MERCHANTS BANCORP INC that investors may wish to consider to help them evaluate FMAO as an investment opportunity.
F&M Bank Opens Regional Headquarters in Fort Wayne, IndianaNew Full-Service Office and Regional Facility Features over 5,000 Square Feet of Space, a Drive-Up ATM and Adds 12 New Full Time Employees ARCHBOLD, Ohio, Nov. 03, 2023 (GLOBE NEWSWIRE) -- F&M Bank (“F&M”), an Archbold, Ohio-based community bank owned by Farmers & Merchants Bancorp, Inc. (Nasdaq: FMAO) today announced the opening of its newest full-service office and new regional headquarters in downtown Fort Wayne. The new office is located at 128 W. Wayne St., Fort Wayne, Indiana 46802. Northe |
Farmers & Merchants Bancorp, Inc. Reports 2023 Third-Quarter and Year-to-Date Financial ResultsARCHBOLD, Ohio, Oct. 26, 2023 (GLOBE NEWSWIRE) -- Farmers & Merchants Bancorp, Inc. (Nasdaq: FMAO) today reported financial results for the 2023 third quarter and year-to-date September 30, 2023. 2023 Third Quarter Financial and Operating Highlights (on a year-over-year basis unless noted): 82 consecutive quarters of profitabilityNet income was $4.8 million, or $0.35 per basic and diluted shareStockholders’ equity increased 8.1% to $303.2 millionRegulatory tangible book value per share increased |
F&M Bank Realigns Organizational Structure to Support Future GrowthBarbara Britenriker, EVP/Chief Financial Officer for F&M Bank and Farmers & Merchants Bancorp, Inc.Katrina DeGroff, SVP/Chief Accounting OfficerAndrew Baker, SVP/Chief Retail Banking Officer and Regional President of Northern IndianaTaryn Marino, SVP/Deputy Chief Retail Banking Officer ARCHBOLD, Ohio, Oct. 25, 2023 (GLOBE NEWSWIRE) -- F&M Bank (“F&M”), an Archbold, Ohio-based community bank owned by Farmers & Merchants Bancorp, Inc. (Nasdaq: FMAO) announced several organizational changes to achi |
Farmers & Merchants Bancorp, Inc. Announces First Full-Service Office in the State of MichiganBirmingham office complements existing F&M loan production office in Bloomfield, MichiganARCHBOLD, Ohio, Oct. 12, 2023 (GLOBE NEWSWIRE) -- F&M Bank (“F&M”), an Archbold, Ohio-based community bank owned by Farmers & Merchants Bancorp, Inc. (Nasdaq: FMAO) today announced the opening of its newest full-service office and first bank office in Michigan. The new office is located at 220 Park St., Suite 104, Birmingham, Michigan 48009. Lars Eller, President and CEO of F&M Bank, stated: “Expanding our p |
Unveiling the Dividend Performance of Farmers & Merchants Bancorp Inc (FMAO)Farmers & Merchants Bancorp Inc (NASDAQ:FMAO) recently announced a dividend of $0.21 per share, payable on 2023-10-20, with the ex-dividend date set for 2023-10-05. As investors look forward to this upcoming payment, the spotlight also shines on the company's dividend history, yield, and growth rates. Using the data from GuruFocus, let's deep dive into Farmers & Merchants Bancorp Inc's dividend performance and assess its sustainability. |
FMAO Price Returns
| 1-mo | 25.92% |
| 3-mo | 30.62% |
| 6-mo | 20.58% |
| 1-year | 26.10% |
| 3-year | 39.40% |
| 5-year | 14.66% |
| YTD | 15.52% |
| 2023 | -5.27% |
| 2022 | -14.95% |
| 2021 | 46.86% |
| 2020 | -21.39% |
| 2019 | -19.94% |
FMAO Dividends
| Ex-Dividend Date | Type | Payout Amount | Change | ||||||
|---|---|---|---|---|---|---|---|---|---|
| Loading, please wait... | |||||||||
Continue Researching FMAO
Want to do more research on Farmers & Merchants Bancorp Inc's stock and its price? Try the links below:Farmers & Merchants Bancorp Inc (FMAO) Stock Price | Nasdaq
Farmers & Merchants Bancorp Inc (FMAO) Stock Quote, History and News - Yahoo Finance
Farmers & Merchants Bancorp Inc (FMAO) Stock Price and Basic Information | MarketWatch
Loading social stream, please wait...