Goldman Sachs BDC, Inc. (GSBD): Price and Financial Metrics
GET POWR RATINGS... FREE!
GSBD POWR Grades
- Momentum is the dimension where GSBD ranks best; there it ranks ahead of 93.06% of US stocks.
- The strongest trend for GSBD is in Sentiment, which has been heading up over the past 177 days.
- GSBD ranks lowest in Growth; there it ranks in the 17th percentile.
GSBD Stock Summary
- The capital turnover (annual revenue relative to shareholder's equity) for GSBD is 0.22 -- better than just 18.35% of US stocks.
- Of note is the ratio of GOLDMAN SACHS BDC INC's sales and general administrative expense to its total operating expenses; 86.98% of US stocks have a lower such ratio.
- For GSBD, its debt to operating expenses ratio is greater than that reported by 99.71% of US equities we're observing.
- If you're looking for stocks that are quantitatively similar to GOLDMAN SACHS BDC INC, a group of peers worth examining would be FSK, NMFC, GBDC, PFLT, and PNNT.
- GSBD's SEC filings can be seen here. And to visit GOLDMAN SACHS BDC INC's official web site, go to homepage.html.
GSBD Valuation Summary
- GSBD's EV/EBIT ratio is 22.5; this is 102.7% higher than that of the median Financial Services stock.
- GSBD's EV/EBIT ratio has moved up 2.5 over the prior 95 months.
Below are key valuation metrics over time for GSBD.
Stock | Date | P/S | P/B | P/E | EV/EBIT |
---|---|---|---|---|---|
GSBD | 2023-01-23 | 4.7 | 1 | 17.5 | 22.5 |
GSBD | 2023-01-20 | 4.6 | 1 | 17.0 | 22.2 |
GSBD | 2023-01-19 | 4.5 | 1 | 16.6 | 22.0 |
GSBD | 2023-01-18 | 4.6 | 1 | 16.9 | 22.2 |
GSBD | 2023-01-17 | 4.6 | 1 | 17.1 | 22.3 |
GSBD | 2023-01-13 | 4.6 | 1 | 16.9 | 22.2 |
GSBD Growth Metrics
- Its 3 year price growth rate is now at -9.45%.
- Its 5 year net cashflow from operations growth rate is now at -1030.83%.
- Its 3 year net income to common stockholders growth rate is now at 359.69%.

The table below shows GSBD's growth in key financial areas (numbers in millions of US dollars).
Date | Revenue | Operating Cash Flow | Net Income to Common Stock |
---|---|---|---|
2022-09-30 | 334.737 | -436.729 | 90.289 |
2022-06-30 | 336.203 | -318.493 | 135.822 |
2022-06-30 | 336.203 | -318.493 | 135.822 |
2022-03-31 | 342.667 | -90.491 | 172.117 |
2021-12-31 | 346.98 | -29.856 | 192.427 |
2021-09-30 | 342.151 | 536.529 | 326.108 |
GSBD's Quality Factors
The “Quality” component of the POWR Ratings focuses on 31 different factors of a companies fundamentals and operational strength. Here are some key insights as we drill into the specifics of these quality attributes.- GSBD has a Quality Grade of B, ranking ahead of 75.18% of graded US stocks.
- GSBD's asset turnover comes in at 0.103 -- ranking 207th of 444 Trading stocks.
- EVR, NDAQ, and EGP are the stocks whose asset turnover ratios are most correlated with GSBD.
The table below shows GSBD's key quality metrics over time.
Period | Asset Turnover | Gross Margin | ROIC |
---|---|---|---|
2021-09-30 | 0.103 | 0.880 | 0.080 |
2021-06-30 | 0.096 | 0.899 | 0.088 |
2021-03-31 | 0.092 | 0.909 | 0.095 |
2020-12-31 | 0.087 | 0.909 | 0.071 |
2020-09-30 | 0.085 | 0.903 | 0.021 |
2020-06-30 | 0.090 | 0.881 | 0.012 |
GSBD Stock Price Chart Interactive Chart >
GSBD Price/Volume Stats
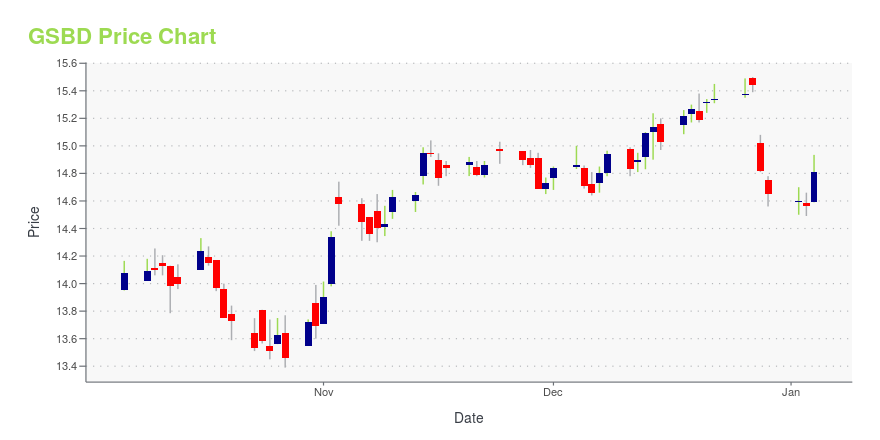
Current price | $15.85 | 52-week high | $20.58 |
Prev. close | $15.86 | 52-week low | $13.54 |
Day low | $15.72 | Volume | 586,400 |
Day high | $16.03 | Avg. volume | 463,609 |
50-day MA | $14.86 | Dividend yield | 11.36% |
200-day MA | $16.40 | Market Cap | 1.63B |
Goldman Sachs BDC, Inc. (GSBD) Company Bio
Goldman Sachs BDC, Inc. is a non-diversified, closed-end management investment company. The Company's investment objective is to generate current income and, to a lesser extent, capital appreciation through direct originations of secured debt, including first lien, first lien/last-out uni-tranche and second lien debt, unsecured debt, including mezzanine debt and, to a lesser extent, investments in equities. The Company invests primarily in the United States middle-market companies. The company was founded in 2012 and is based in New York City, New York.
Latest GSBD News From Around the Web
Below are the latest news stories about GOLDMAN SACHS BDC INC that investors may wish to consider to help them evaluate GSBD as an investment opportunity.
How Goldman can regain its swaggerGoldman Sachs has lost its swagger. The market value of the venerable 154-year-old investment bank, at $121bn, is now $42bn less than its longtime arch-rival Morgan Stanley. It used to be that Goldman was the more valuable bank for many years. |
Letter: Don’t gloat over GoldmanAs John Gapper explains (“Morgan Stanley pulls the Pepsi trick on Goldman”, Opinion, January 21) when “Goldman was a private partnership, it could decide its own destiny”.Now it’s more apparent Goldman Sachs doesn’t need to live up to the expectation of critics. |
13 Best Value Dividend Stocks to BuyIn this article, we take a look at 13 best value dividend stocks to buy. If you want to see more best value dividend stocks to buy, go directly to 5 Best Value Dividend Stocks to Buy. Value stocks are stocks of companies generally considered trading below what many investors think they are worth. Because […] |
Goldman Sachs (GS) Could Be a Great ChoiceDividends are one of the best benefits to being a shareholder, but finding a great dividend stock is no easy task. Does Goldman Sachs (GS) have what it takes? Let's find out. |
Goldman Sachs, JPMorgan Say Adani Debt Offers Value to Trading Clients(Bloomberg) -- Goldman Sachs Group Inc. and JPMorgan Chase & Co. have told some clients that bonds related to Gautam Adani’s business empire can offer value due to the strength of certain assets.Most Read from BloombergWhat You Need to Know About the Chinese Spy Balloon Floating Over the USMerck Covid Drug Linked to New Virus Mutations, Study SaysUS Weighs Calling Off Blinken Visit to China Over Spy BalloonAdani Crisis Deepens as Stock Rout Hits $108 BillionAdani’s $108 Billion Crisis Shakes Inv |
GSBD Price Returns
1-mo | 11.31% |
3-mo | 1.79% |
6-mo | -5.09% |
1-year | -12.96% |
3-year | 2.23% |
5-year | 24.67% |
YTD | 15.52% |
2022 | -20.13% |
2021 | 10.85% |
2020 | 0.71% |
2019 | 26.36% |
2018 | -9.44% |
GSBD Dividends
Ex-Dividend Date | Type | Payout Amount | Change | ||||||
---|---|---|---|---|---|---|---|---|---|
Loading, please wait... |
Continue Researching GSBD
Here are a few links from around the web to help you further your research on Goldman Sachs BDC Inc's stock as an investment opportunity:Goldman Sachs BDC Inc (GSBD) Stock Price | Nasdaq
Goldman Sachs BDC Inc (GSBD) Stock Quote, History and News - Yahoo Finance
Goldman Sachs BDC Inc (GSBD) Stock Price and Basic Information | MarketWatch
Loading social stream, please wait...