HCI Group, Inc. (HCI): Price and Financial Metrics
GET POWR RATINGS... FREE!
HCI Price/Volume Stats
Current price | $54.72 | 52-week high | $73.16 |
Prev. close | $55.35 | 52-week low | $27.65 |
Day low | $54.65 | Volume | 40,800 |
Day high | $56.73 | Avg. volume | 93,809 |
50-day MA | $53.30 | Dividend yield | 2.89% |
200-day MA | $46.42 | Market Cap | 470.43M |
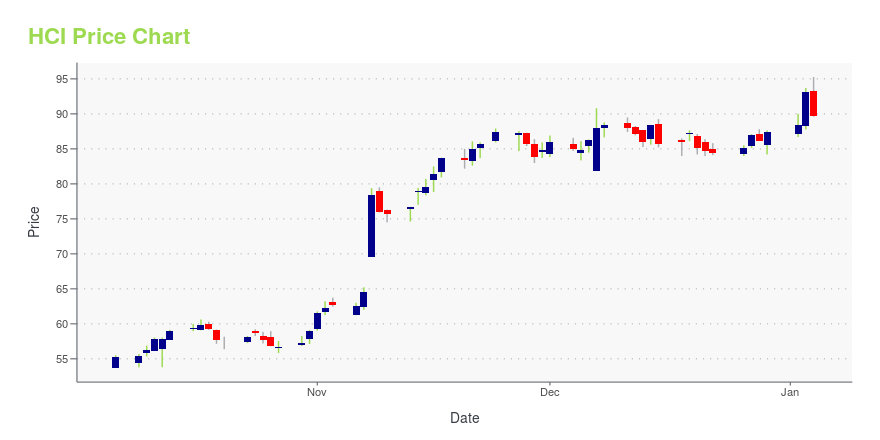
HCI Stock Price Chart Interactive Chart >
HCI POWR Grades
- HCI scores best on the Momentum dimension, with a Momentum rank ahead of 87.05% of US stocks.
- HCI's strongest trending metric is Growth; it's been moving up over the last 179 days.
- HCI's current lowest rank is in the Value metric (where it is better than 21.74% of US stocks).
HCI Stock Summary
- Equity multiplier, or assets relative to shareholders' equity, comes in at 9.26 for HCI GROUP INC; that's greater than it is for 88.58% of US stocks.
- With a year-over-year growth in debt of 213.83%, HCI GROUP INC's debt growth rate surpasses 93.41% of about US stocks.
- Over the past twelve months, HCI has reported earnings growth of -1,359.42%, putting it ahead of merely 1.41% of US stocks in our set.
- If you're looking for stocks that are quantitatively similar to HCI GROUP INC, a group of peers worth examining would be ESQ, MNSB, LKFN, BWFG, and AX.
- HCI's SEC filings can be seen here. And to visit HCI GROUP INC's official web site, go to www.hcigroup.com.
HCI Valuation Summary
- HCI's price/sales ratio is 1; this is 54.55% lower than that of the median Financial Services stock.
- HCI's EV/EBIT ratio has moved down 10.3 over the prior 179 months.
Below are key valuation metrics over time for HCI.
Stock | Date | P/S | P/B | P/E | EV/EBIT |
---|---|---|---|---|---|
HCI | 2023-05-19 | 1 | 2.7 | -10.9 | -8.5 |
HCI | 2023-05-18 | 1 | 2.7 | -11.0 | -8.6 |
HCI | 2023-05-17 | 1 | 2.7 | -11.1 | -8.7 |
HCI | 2023-05-16 | 1 | 2.7 | -11.0 | -8.6 |
HCI | 2023-05-15 | 1 | 2.7 | -11.1 | -8.7 |
HCI | 2023-05-12 | 1 | 2.7 | -11.1 | -8.7 |
HCI Growth Metrics
- Its 2 year price growth rate is now at 63.13%.
- The 4 year net income to common stockholders growth rate now stands at -41.73%.
- The 4 year revenue growth rate now stands at -12.6%.

The table below shows HCI's growth in key financial areas (numbers in millions of US dollars).
Date | Revenue | Operating Cash Flow | Net Income to Common Stock |
---|---|---|---|
2022-09-30 | 491.94 | 29.571 | -60.009 |
2022-06-30 | 464.503 | 22.485 | -15.287 |
2022-03-31 | 440.081 | 117.712 | -3.389 |
2021-12-31 | 407.915 | 96.503 | 1.856 |
2021-09-30 | 365.908 | 48.452 | 4.535 |
2021-06-30 | 370.718 | 62.97 | 26.162 |
HCI's Quality Factors
The “Quality” component of the POWR Ratings focuses on 31 different factors of a companies fundamentals and operational strength. Here are some key insights as we drill into the specifics of these quality attributes.- HCI has a Quality Grade of C, ranking ahead of 69% of graded US stocks.
- HCI's asset turnover comes in at 0.378 -- ranking 39th of 133 Insurance stocks.
- ESNT, KNSL, and ITIC are the stocks whose asset turnover ratios are most correlated with HCI.
The table below shows HCI's key quality metrics over time.
Period | Asset Turnover | Gross Margin | ROIC |
---|---|---|---|
2021-06-30 | 0.378 | 0.477 | 0.074 |
2021-03-31 | 0.375 | 0.492 | 0.087 |
2020-12-31 | 0.349 | 0.484 | 0.073 |
2020-09-30 | 0.355 | 0.510 | 0.080 |
2020-06-30 | 0.308 | 0.521 | 0.056 |
2020-03-31 | 0.293 | 0.542 | 0.053 |
HCI Price Target
For more insight on analysts targets of HCI, see our HCI price target page. And for a list of of all stocks sorted by upside potential based on analyst target price, see our Top Price Target page.
Average Price Target | $105.00 | Average Broker Recommendation | 1.67 (Moderate Buy) |
HCI Group, Inc. (HCI) Company Bio
HCI Group provides property and casualty insurance products in Florida. The company provides property and casualty insurance to homeowners, condominium owners, and tenants; and reinsurance. The company was founded in 2006 and is based in Tampa, Florida.
Latest HCI News From Around the Web
Below are the latest news stories about HCI GROUP INC that investors may wish to consider to help them evaluate HCI as an investment opportunity.
HCI Group to Participate in the Truist Securities Financial Services ConferenceTAMPA, Fla., May 19, 2023 (GLOBE NEWSWIRE) -- HCI Group, Inc. (NYSE:HCI), a holding company with operations in homeowners insurance, information technology services, real estate, and reinsurance, will participate in the Truist Securities Financial Services Conference in New York, NY on May 23, 2023. HCI Group Chief Financial Officer Mark Harmsworth and TypTap Insurance Company President Kevin Mitchell will hold one-on-one meetings with institutional investors throughout the day. For additional i |
Does HCI Group (HCI) Have the Potential to Rally 41.5% as Wall Street Analysts Expect?The mean of analysts' price targets for HCI Group (HCI) points to a 41.5% upside in the stock. While this highly sought-after metric has not proven reasonably effective, strong agreement among analysts in raising earnings estimates does indicate an upside in the stock. |
HCI Group Inc. (HCI) Q1 2023 Earnings Call TranscriptHCI Group Inc. (HCI) Q1 2023 Results Conference Call May 09, 2023 4:45 PM ET Company Participants Matt Glover - Senior MD Karin Coleman - COO & Director James Harmsworth - CFO Pareshbhai Patel - Founder, Chairman, President & CEO Conference Call Participants Mark Hughes - Truist Matt Carletti - JMP Presentation Operator Good afternoon and welcome to HCI Group's First Quarter 2023 Earnings Call. My name is John, and I will be your conference operator. [Operator Instructions] Before we begin today's call, I would like to remind everyone that this conference is being recorded and will be available for replay through June 8, 2023, start... |
Can HCI Group (HCI) Run Higher on Rising Earnings Estimates?HCI Group (HCI) shares have started gaining and might continue moving higher in the near term, as indicated by solid earnings estimate revisions. |
Here's Why Kinsale Capital (KNSL) Stock is a Solid Pick NowKinsale Capital (KNSL) stands to gain from rate increases, higher premium growth rate and lower reinstatement premiums and prudent capital deployment. |
HCI Price Returns
1-mo | 8.78% |
3-mo | 4.97% |
6-mo | 48.42% |
1-year | -18.18% |
3-year | 31.84% |
5-year | 50.77% |
YTD | 40.29% |
2022 | -51.20% |
2021 | 62.74% |
2020 | 18.45% |
2019 | -6.80% |
2018 | 75.98% |
HCI Dividends
Ex-Dividend Date | Type | Payout Amount | Change | ||||||
---|---|---|---|---|---|---|---|---|---|
Loading, please wait... |
Continue Researching HCI
Want to see what other sources are saying about HCI Group Inc's financials and stock price? Try the links below:HCI Group Inc (HCI) Stock Price | Nasdaq
HCI Group Inc (HCI) Stock Quote, History and News - Yahoo Finance
HCI Group Inc (HCI) Stock Price and Basic Information | MarketWatch
Loading social stream, please wait...