
Hartford Financial Services Group Inc. (HIG): Price and Financial Metrics
HIG Price/Volume Stats
| Current price | $109.63 | 52-week high | $109.68 |
| Prev. close | $102.33 | 52-week low | $68.82 |
| Day low | $106.65 | Volume | 2,870,700 |
| Day high | $109.68 | Avg. volume | 1,670,145 |
| 50-day MA | $101.60 | Dividend yield | 1.84% |
| 200-day MA | $90.86 | Market Cap | 32.42B |
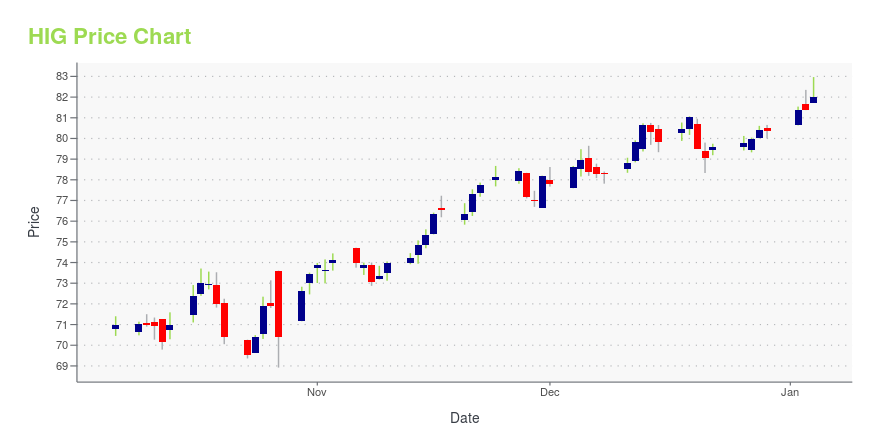
HIG Stock Price Chart Interactive Chart >
Hartford Financial Services Group Inc. (HIG) Company Bio
The Hartford Financial Services Group, Inc., usually known as The Hartford, is a United States-based investment and insurance company. The Hartford is a Fortune 500 company headquartered in its namesake city of Hartford, Connecticut. It was ranked 160th in Fortune 500 in the year of 2020. The company's earnings are divided between property-and-casualty operations, group benefits and mutual funds. (Source:Wikipedia)
Latest HIG News From Around the Web
Below are the latest news stories about HARTFORD FINANCIAL SERVICES GROUP INC that investors may wish to consider to help them evaluate HIG as an investment opportunity.
Why You Should Add RenaissanceRe (RNR) Stock to Your PortfolioAn improvement in the top line led by higher premiums and net investment income poises RenaissanceRe (RNR) well for growth. |
Here's Why Assurant (AIZ) Stock is Investors' Favorite NowAssurant (AIZ) appears poised for growth on a well-performing Global Lifestyle business, growth of fee-based capital-light businesses and solid capital management. |
15 Best Multi Policy Insurance Companies Heading into 2024In this article, we will take a look at the 15 best multi policy insurance companies heading into 2024. If you want to skip our detailed analysis, you can go directly to 5 Best Multi Policy Insurance Companies Heading into 2024. The Revolution in the Insurance Industry The insurance industry is constantly evolving to offer […] |
15 Best Building Insurance Companies Heading into 2024In this article, we will discuss the 15 best building insurance companies heading into 2024. If you want to skip our detailed analysis, you can go directly to 5 Best Building Insurance Companies Heading into 2024. Is Artificial Intelligence Changing the Insurance Landscape? Like most industries, the insurance industry is also constantly changing to adapt […] |
Hartford Financial Services Group (NYSE:HIG) shareholders have earned a 16% CAGR over the last five yearsIf you want to compound wealth in the stock market, you can do so by buying an index fund. But the truth is, you can... |
HIG Price Returns
| 1-mo | 7.23% |
| 3-mo | 15.56% |
| 6-mo | 27.49% |
| 1-year | 47.25% |
| 3-year | 89.27% |
| 5-year | 112.18% |
| YTD | 37.69% |
| 2023 | 8.55% |
| 2022 | 12.31% |
| 2021 | 44.23% |
| 2020 | -16.98% |
| 2019 | 39.71% |
HIG Dividends
| Ex-Dividend Date | Type | Payout Amount | Change | ||||||
|---|---|---|---|---|---|---|---|---|---|
| Loading, please wait... | |||||||||
Continue Researching HIG
Here are a few links from around the web to help you further your research on Hartford Financial Services Group Inc's stock as an investment opportunity:Hartford Financial Services Group Inc (HIG) Stock Price | Nasdaq
Hartford Financial Services Group Inc (HIG) Stock Quote, History and News - Yahoo Finance
Hartford Financial Services Group Inc (HIG) Stock Price and Basic Information | MarketWatch
Loading social stream, please wait...