
Himax Technologies Inc. ADR (HIMX): Price and Financial Metrics
HIMX Price/Volume Stats
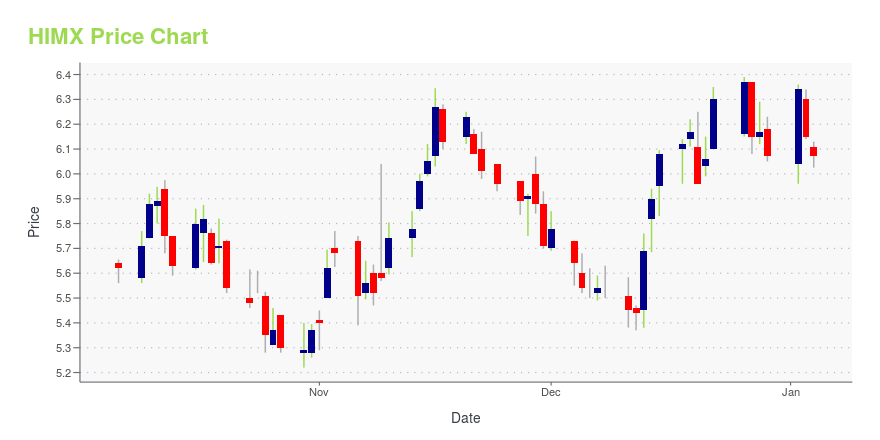
| Current price | $7.11 | 52-week high | $8.73 |
| Prev. close | $7.12 | 52-week low | $4.80 |
| Day low | $7.03 | Volume | 855,800 |
| Day high | $7.18 | Avg. volume | 816,999 |
| 50-day MA | $7.29 | Dividend yield | 3.75% |
| 200-day MA | $6.05 | Market Cap | 1.24B |
HIMX Stock Price Chart Interactive Chart >
Himax Technologies Inc. ADR (HIMX) Company Bio
Himax Technologies, Inc. is a semiconductor solution provider dedicated to display imaging processing technologies. It operates through the Driver Integrated Circuit and Non-Driver Products segments. The company's products include display drivers, timing controllers, wafer level optics, video and display technology solutions, liquid crystal over silicon silicon, complementary metal-oxide semiconductor image sensor, and power integrated circuit. Its products used in TVs, laptops, monitors, mobile phones, tablets, digital cameras, car navigation, virtual reality (VR) devices and many other consumer electronics devices. Himax Technologies was founded by Biing Seng Wu and Jordan Wu on June 12, 2001 and is headquartered in Tainan, Taiwan.
Latest HIMX News From Around the Web
Below are the latest news stories about HIMAX TECHNOLOGIES INC that investors may wish to consider to help them evaluate HIMX as an investment opportunity.
12 High Growth Semiconductor Stocks That Are ProfitableIn this article, we discuss the 12 high-growth semiconductor stocks that are profitable. To skip the detailed analysis of the semiconductor industry, go directly to the 5 High Growth Semiconductor Stocks That Are Profitable. Semiconductors are a global need and their supply is required by every sector of the market. The industry has been facing […] |
Himax to Feature Exclusive Next Gen Color Sequential Front-Lit LCoS and 3D Sensing Technologies at CES 2024Ultra Luminous Microdisplay and Agile 3D Perception Solution Further Demonstrate Leading Immersive AR CapabilitiesTAINAN, Taiwan, Dec. 22, 2023 (GLOBE NEWSWIRE) -- Himax Technologies, Inc. (Nasdaq: HIMX) (“Himax” or “Company”), a leading supplier and fabless manufacturer of display drivers and other semiconductor products, today announced the Company will feature live showcases of its next generation proprietary ultra luminous Color Sequential Front-Lit LCoS and agile 3D Sensing technologies in |
7 Penny Stocks With Massive Upside (That Are NOT Biopharma)The world of penny stocks worth buying extends beyond the biopharma sector even though that industry receives massive attention. |
7 Penny Stocks With Massive Upside (That Are NOT Biopharma)For investors, there’s no shortage of penny stocks from which to choose within the biopharma sector. Successful companies in this industry often achieve strong returns due to FDA approval. That raises a question: Where do investors look for strong returns from penny stocks outside of the biopharma sector? Fortunately, for them, there are still plenty of stocks to consider that have nothing to do with pharmaceuticals or medical devices. Today we’re going to look at a handful of those companies an |
Himax to Present Innovative Solutions for tinyML Opportunities with WiseEye™ AI During CES 2024Showcase with Ecosystem Partners in tinyML Applications, Featuring High-Performance AI and Ultralow Power Consumption Across Diverse DomainsTAINAN, Taiwan, Dec. 20, 2023 (GLOBE NEWSWIRE) -- Himax Technologies, Inc. (Nasdaq: HIMX) (“Himax” or “Company”), a leading supplier and fabless manufacturer of display drivers and other semiconductor products, today announced that during CES 2024 the Company will unveil its new generation WiseEyeTM AI processor, WE2, with a diverse array of new sensor fusio |
HIMX Price Returns
| 1-mo | -11.57% |
| 3-mo | 45.98% |
| 6-mo | 23.66% |
| 1-year | 5.11% |
| 3-year | -31.29% |
| 5-year | 193.40% |
| YTD | 21.21% |
| 2023 | 4.57% |
| 2022 | -54.91% |
| 2021 | 120.20% |
| 2020 | 177.82% |
| 2019 | -22.45% |
HIMX Dividends
| Ex-Dividend Date | Type | Payout Amount | Change | ||||||
|---|---|---|---|---|---|---|---|---|---|
| Loading, please wait... | |||||||||
Continue Researching HIMX
Here are a few links from around the web to help you further your research on Himax Technologies Inc's stock as an investment opportunity:Himax Technologies Inc (HIMX) Stock Price | Nasdaq
Himax Technologies Inc (HIMX) Stock Quote, History and News - Yahoo Finance
Himax Technologies Inc (HIMX) Stock Price and Basic Information | MarketWatch
Loading social stream, please wait...