Installed Building Products, Inc. (IBP): Price and Financial Metrics
IBP Price/Volume Stats
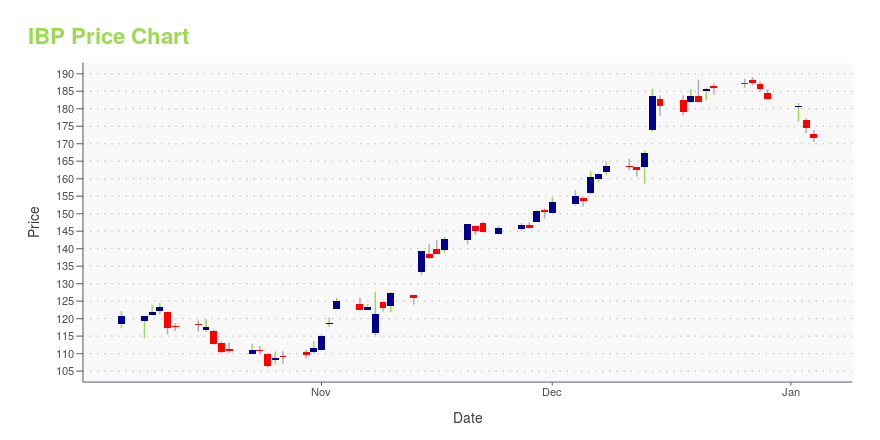
Current price | $121.66 | 52-week high | $158.18 |
Prev. close | $123.81 | 52-week low | $74.69 |
Day low | $121.45 | Volume | 160,491 |
Day high | $124.43 | Avg. volume | 225,568 |
50-day MA | $142.39 | Dividend yield | 1.07% |
200-day MA | $119.61 | Market Cap | 3.46B |
IBP Stock Price Chart Interactive Chart >
IBP POWR Grades
- IBP scores best on the Quality dimension, with a Quality rank ahead of 94.8% of US stocks.
- The strongest trend for IBP is in Growth, which has been heading down over the past 177 days.
- IBP's current lowest rank is in the Sentiment metric (where it is better than 16.97% of US stocks).
IBP Stock Summary
- The capital turnover (annual revenue relative to shareholder's equity) for IBP is 4.92 -- better than 90.62% of US stocks.
- Of note is the ratio of INSTALLED BUILDING PRODUCTS INC's sales and general administrative expense to its total operating expenses; 78.98% of US stocks have a lower such ratio.
- In terms of twelve month growth in earnings before interest and taxes, INSTALLED BUILDING PRODUCTS INC is reporting a growth rate of 45.14%; that's higher than 79.41% of US stocks.
- Stocks with similar financial metrics, market capitalization, and price volatility to INSTALLED BUILDING PRODUCTS INC are RUSHA, ALG, ESAB, PGTI, and BXC.
- Visit IBP's SEC page to see the company's official filings. To visit the company's web site, go to www.installedbuildingproducts.com.
IBP Valuation Summary
- In comparison to the median Consumer Cyclical stock, IBP's price/sales ratio is 26.32% lower, now standing at 1.4.
- Over the past 117 months, IBP's price/sales ratio has gone up 0.2.
Below are key valuation metrics over time for IBP.
Stock | Date | P/S | P/B | P/E | EV/EBIT |
---|---|---|---|---|---|
IBP | 2023-09-13 | 1.4 | 6.7 | 15.6 | 12.1 |
IBP | 2023-09-12 | 1.4 | 6.9 | 16.1 | 12.5 |
IBP | 2023-09-11 | 1.4 | 7.0 | 16.2 | 12.6 |
IBP | 2023-09-08 | 1.4 | 7.0 | 16.2 | 12.6 |
IBP | 2023-09-07 | 1.4 | 7.0 | 16.4 | 12.7 |
IBP | 2023-09-06 | 1.4 | 7.0 | 16.4 | 12.7 |
IBP Growth Metrics
- Its 2 year price growth rate is now at 56.79%.
- Its 5 year net income to common stockholders growth rate is now at 93.17%.
- Its 4 year net cashflow from operations growth rate is now at 107.04%.

The table below shows IBP's growth in key financial areas (numbers in millions of US dollars).
Date | Revenue | Operating Cash Flow | Net Income to Common Stock |
---|---|---|---|
2022-12-31 | 2,669.844 | 277.904 | 223.428 |
2022-09-30 | 2,517.078 | 220.503 | 184.071 |
2022-06-30 | 2,307.727 | 154.339 | 157.985 |
2022-03-31 | 2,119.076 | 148.921 | 135.294 |
2021-12-31 | 1,968.65 | 138.314 | 118.763 |
2021-09-30 | 1,876.396 | 153.383 | 117.233 |
IBP's Quality Factors
The “Quality” component of the POWR Ratings focuses on 31 different factors of a companies fundamentals and operational strength. Here are some key insights as we drill into the specifics of these quality attributes.- IBP has a Quality Grade of B, ranking ahead of 93.48% of graded US stocks.
- IBP's asset turnover comes in at 1.495 -- ranking 14th of 51 Construction stocks.
- STRL, DY, and GRBK are the stocks whose asset turnover ratios are most correlated with IBP.
The table below shows IBP's key quality metrics over time.
Period | Asset Turnover | Gross Margin | ROIC |
---|---|---|---|
2021-09-30 | 1.495 | 0.303 | 0.187 |
2021-06-30 | 1.471 | 0.304 | 0.181 |
2021-03-31 | 1.435 | 0.307 | 0.172 |
2020-12-31 | 1.447 | 0.308 | 0.170 |
2020-09-30 | 1.439 | 0.307 | 0.158 |
2020-06-30 | 1.451 | 0.303 | 0.151 |
IBP Price Target
For more insight on analysts targets of IBP, see our IBP price target page. And for a list of of all stocks sorted by upside potential based on analyst target price, see our Top Price Target page.
Average Price Target | $141.20 | Average Broker Recommendation | 1.59 (Moderate Buy) |
Installed Building Products, Inc. (IBP) Company Bio
Installed Building Products provides insulation installation services for the residential new construction market and is also a diversified installer of complementary building products, including garage doors, rain gutters, shower doors, closet shelving and mirrors, throughout the United States. The company was founded in 1977 and is based in Columbus, Ohio.
Latest IBP News From Around the Web
Below are the latest news stories about INSTALLED BUILDING PRODUCTS INC that investors may wish to consider to help them evaluate IBP as an investment opportunity.
Shareholders Would Enjoy A Repeat Of Installed Building Products' (NYSE:IBP) Recent Growth In ReturnsThere are a few key trends to look for if we want to identify the next multi-bagger. Firstly, we'd want to identify a... |
After Plunging -11.24% in 4 Weeks, Here's Why the Trend Might Reverse for Installed Building Products (IBP)Installed Building Products (IBP) is technically in oversold territory now, so the heavy selling pressure might have exhausted. This along with strong agreement among Wall Street analysts in raising earnings estimates could lead to a trend reversal for the stock. |
After Plunging -10.51% in 4 Weeks, Here's Why the Trend Might Reverse for Installed Building Products (IBP)The heavy selling pressure might have exhausted for Installed Building Products (IBP) as it is technically in oversold territory now. In addition to this technical measure, strong agreement among Wall Street analysts in revising earnings estimates higher indicates that the stock is ripe for a trend reversal. |
Why You Might Be Interested In Installed Building Products, Inc. (NYSE:IBP) For Its Upcoming DividendInstalled Building Products, Inc. ( NYSE:IBP ) is about to trade ex-dividend in the next 3 days. The ex-dividend date... |
Is Installed Building Products (IBP) Stock Undervalued Right Now?Here at Zacks, our focus is on the proven Zacks Rank system, which emphasizes earnings estimates and estimate revisions to find great stocks. Nevertheless, we are always paying attention to the latest value, growth, and momentum trends to underscore strong picks. |
IBP Price Returns
1-mo | -10.99% |
3-mo | -9.04% |
6-mo | 11.04% |
1-year | 62.24% |
3-year | 33.37% |
5-year | 220.55% |
YTD | 44.50% |
2022 | -37.51% |
2021 | 38.43% |
2020 | 48.00% |
2019 | 104.42% |
2018 | -55.64% |
IBP Dividends
Ex-Dividend Date | Type | Payout Amount | Change | ||||||
---|---|---|---|---|---|---|---|---|---|
Loading, please wait... |
Continue Researching IBP
Here are a few links from around the web to help you further your research on Installed Building Products Inc's stock as an investment opportunity:Installed Building Products Inc (IBP) Stock Price | Nasdaq
Installed Building Products Inc (IBP) Stock Quote, History and News - Yahoo Finance
Installed Building Products Inc (IBP) Stock Price and Basic Information | MarketWatch
Loading social stream, please wait...