
Imperial Oil Ltd. (IMO): Price and Financial Metrics
IMO Price/Volume Stats
| Current price | $71.03 | 52-week high | $74.58 |
| Prev. close | $70.60 | 52-week low | $51.23 |
| Day low | $69.85 | Volume | 239,800 |
| Day high | $71.19 | Avg. volume | 386,309 |
| 50-day MA | $68.27 | Dividend yield | 2.54% |
| 200-day MA | $63.27 | Market Cap | 38.06B |
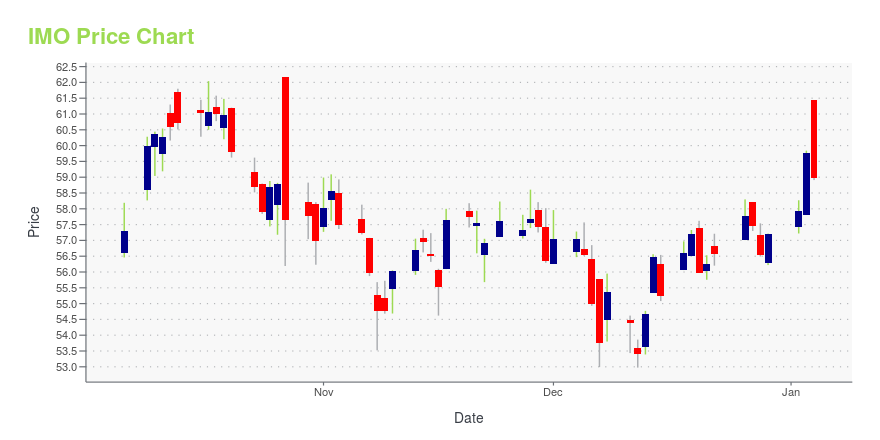
IMO Stock Price Chart Interactive Chart >
Imperial Oil Ltd. (IMO) Company Bio
Imperial Oil Limited (French: Compagnie Pétrolière Impériale Ltée) is a Canadian petroleum company. It is Canada's second-biggest integrated oil company. It is majority owned by American oil company ExxonMobil with around 69.6 percent ownership stake in the company. It is a significant producer of crude oil, diluted bitumen and natural gas, Canada's major petroleum refiner, a key petrochemical producer and a national marketer with coast-to-coast supply and retail networks. It supplies Esso-brand service stations. (Source:Wikipedia)
Latest IMO News From Around the Web
Below are the latest news stories about IMPERIAL OIL LTD that investors may wish to consider to help them evaluate IMO as an investment opportunity.
Here's Why You Should Hold on to Enbridge (ENB) Stock NowEnbridge (ENB) is strategically positioned to benefit from industry trends, such as increasing demand for renewable energy and natural gas. |
Equinor (EQNR) Barred From Repeating Green Claims in the UKEquinor's (EQNR) advertisements have been scrutinized by the ASA for potentially conveying a misleading impression to the public. |
Oil & Gas Stock Roundup: Exxon's Hebron Approval & Shell's Sparta FID Stand OutXOM, SHEL, EQNR, CVE and IMO emerge as the energy headline makers during the week. |
Imperial Oil (IMO) Issues 2024 Outlook and C$1.7B Capex PlanImperial Oil (IMO) issues its 2024 production guidance, earmarking C$1.7 billion for capital expenditures and affirming its commitment to renewable diesel. |
Imperial provides 2024 corporate guidance outlookCALGARY, Alberta, December 18, 2023--Imperial (TSE: IMO, NYSE American: IMO) today provided an update on its corporate guidance outlook for 2024. The company’s strategy remains focused on maximizing value of existing assets and progressing select high-value growth opportunities while continuing to reduce company emissions and delivering industry-leading returns to shareholders. |
IMO Price Returns
| 1-mo | 4.87% |
| 3-mo | 1.74% |
| 6-mo | 26.51% |
| 1-year | 42.35% |
| 3-year | 189.72% |
| 5-year | 197.47% |
| YTD | 26.67% |
| 2023 | 20.62% |
| 2022 | 38.01% |
| 2021 | 92.50% |
| 2020 | -25.39% |
| 2019 | 7.15% |
IMO Dividends
| Ex-Dividend Date | Type | Payout Amount | Change | ||||||
|---|---|---|---|---|---|---|---|---|---|
| Loading, please wait... | |||||||||
Continue Researching IMO
Here are a few links from around the web to help you further your research on Imperial Oil Ltd's stock as an investment opportunity:Imperial Oil Ltd (IMO) Stock Price | Nasdaq
Imperial Oil Ltd (IMO) Stock Quote, History and News - Yahoo Finance
Imperial Oil Ltd (IMO) Stock Price and Basic Information | MarketWatch
Loading social stream, please wait...