
Independent Bank Corp. (INDB): Price and Financial Metrics
INDB Price/Volume Stats
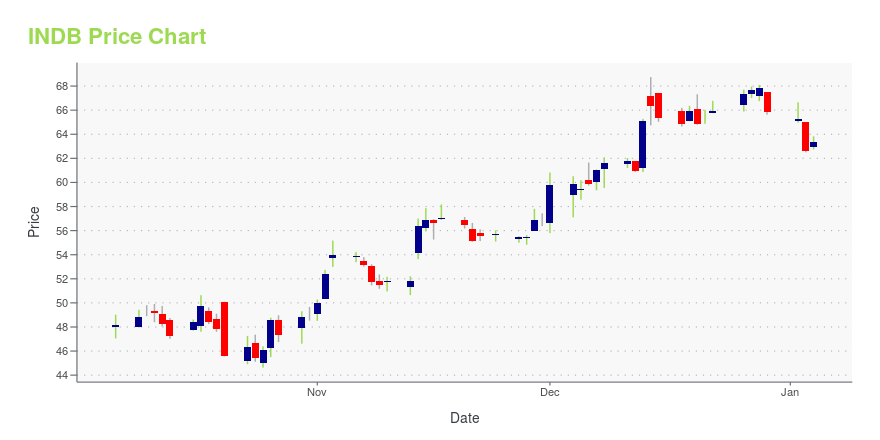
| Current price | $64.15 | 52-week high | $68.75 |
| Prev. close | $63.00 | 52-week low | $44.63 |
| Day low | $62.47 | Volume | 252,800 |
| Day high | $64.18 | Avg. volume | 292,818 |
| 50-day MA | $51.58 | Dividend yield | 3.66% |
| 200-day MA | $53.78 | Market Cap | 2.72B |
INDB Stock Price Chart Interactive Chart >
Independent Bank Corp. (INDB) Company Bio
Independent Bank Corporation provides banking products and services primarily to small-to-medium sized businesses and individuals in Massachusetts. The company was founded in 1907 and is based in Rockland, Massachusetts.
Latest INDB News From Around the Web
Below are the latest news stories about INDEPENDENT BANK CORP that investors may wish to consider to help them evaluate INDB as an investment opportunity.
Independent Bank Corp's Dividend AnalysisIndependent Bank Corp (NASDAQ:INDB) recently announced a dividend of $0.55 per share, payable on 2024-01-05, with the ex-dividend date set for 2023-12-22. As investors look forward to this upcoming payment, the spotlight also shines on the company's dividend history, yield, and growth rates. Using the data from GuruFocus, let's look into Independent Bank Corp's dividend performance and assess its sustainability. |
Independent Bank Corp. Announces Quarterly DividendROCKLAND, Mass., December 14, 2023--The Board of Directors of Independent Bank Corp. (Nasdaq Global Select Market: INDB), parent of Rockland Trust Company, today announced a $0.55 per share dividend. The dividend will be payable on January 5, 2024, to stockholders of record as of the close of business on December 26, 2023. |
Zebra Technologies' (ZBRA) Solution Chosen by Rockland TrustZebra Technologies (ZBRA) offers its Zebra Workcloud software solutions to boost Rockland Trust's customer experience by improving branch operations, and increasing visibility and communication. |
Independent Bank Corp. CEO Jeffrey Tengel and CFO Mark J. Ruggiero to Participate in the 2023 Piper Sandler East Coast Financial Services ConferenceROCKLAND, Mass., November 06, 2023--Jeffrey Tengel, Chief Executive Officer and Mark J. Ruggiero, Chief Financial Officer and Executive Vice President of Consumer Lending of Independent Bank Corp. (NASDAQ Global Select Market: INDB) will participate in the 2023 Piper Sandler East Coast Financial Services Conference on November 16, 2023. The conference will take place at the JW Marriott Miami Turnberry Resort, 19999 W. Country Club Dr., Aventura, FL 33180. |
Insider Buying: CEO Jeffrey Tengel Acquires 2,100 Shares of Independent Bank CorpOn October 30, 2023, Jeffrey Tengel, CEO of Independent Bank Corp (NASDAQ:INDB), purchased 2,100 shares of the company, signaling a strong vote of confidence in the bank's future prospects. |
INDB Price Returns
| 1-mo | 37.92% |
| 3-mo | 23.04% |
| 6-mo | 10.44% |
| 1-year | 11.41% |
| 3-year | 2.88% |
| 5-year | -3.87% |
| YTD | -0.34% |
| 2023 | -18.86% |
| 2022 | 6.25% |
| 2021 | 14.36% |
| 2020 | -9.62% |
| 2019 | 21.11% |
INDB Dividends
| Ex-Dividend Date | Type | Payout Amount | Change | ||||||
|---|---|---|---|---|---|---|---|---|---|
| Loading, please wait... | |||||||||
Continue Researching INDB
Want to do more research on Independent Bank Corp's stock and its price? Try the links below:Independent Bank Corp (INDB) Stock Price | Nasdaq
Independent Bank Corp (INDB) Stock Quote, History and News - Yahoo Finance
Independent Bank Corp (INDB) Stock Price and Basic Information | MarketWatch
Loading social stream, please wait...